To understand and measure this fear, most analysts make use of the Volatility Index (VIX), commonly referred to as the “fear gauge.” The VIX tracks market expectations of volatility, rising when fear is prevalent and falling when markets are calm. As an investor, keeping an eye on the VIX could provide crucial insights into the prevalent market sentiment.
The Transition To FOMO
The journey from fear to FOMO is a complex one, but it often follows a pattern. As fear subsides or market conditions improve, investor sentiment starts to shift. Positive news, low volatility, or strong earnings reports can drive this transition. Gradually, the market mood becomes more optimistic, and the fear dissipates, making way for the emergence of FOMO.
FOMO is a potent emotion. Investors experiencing it worry that they are missing out on potential gains. This fear of missing out can lead to impulsive buying, driving up prices.
An example of FOMO-driven buying comes from the GameStop stock frenzy of early 2021. A group of retail investors on the Reddit forum r/WallStreetBets drove the stock up by an astonishing 1,500% in just two weeks. This FOMO-driven rally squeezed out short-selling hedge funds, causing a whirlwind of market excitement.
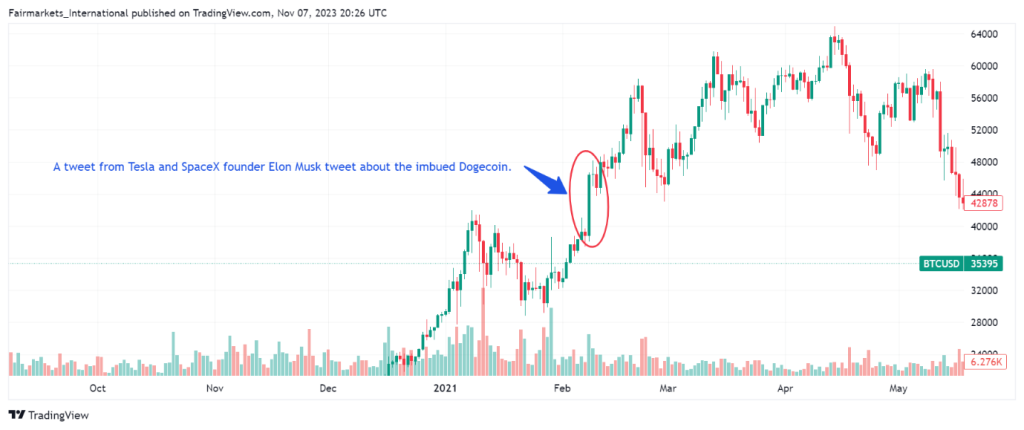
Elon Musk’s Dogecoin tweet triggered another infamous FOMO-induced buying. In early 2021, a single tweet from Tesla and SpaceX founder Elon Musk sent Bitcoin prices soaring by 20% or more in a matter of hours. Musk’s influence created a sense of urgency, driving FOMO-induced buying among investors.
Technical Analysis And Market Sentiment
In the context of shifting from fear to FOMO, analysts often rely on two key indicators: the Moving Average and the Relative Strength Index (RSI).
- Moving Average: Moving averages help investors identify the trend of an asset. When an asset’s price crosses above its moving average, it may signal a shift from bearish (fear-driven) to bullish (FOMO-driven) sentiment. Investors often use the 50-day and 200-day moving averages as key reference points.
- Relative Strength Index (RSI): RSI measures the speed and change of price movements. It ranges from 0 to 100 and helps identify overbought or oversold conditions. When RSI climbs above 70, it might signal overbought conditions, potentially indicating the presence of FOMO.
Measuring The Transition: Market Indices
Several market indices provide insights into the shift from fear to FOMO. Let’s consider a few:
- S&P 500: The S&P 500 is often considered a barometer of the US stock market. When this index rises steadily, it can be indicative of a shift towards FOMO as investors gain confidence in the market’s direction.
- Nasdaq Composite Index: As a tech-heavy index, the Nasdaq often reflects investor sentiment towards innovation and emerging technologies. A surge in the Nasdaq can signify FOMO towards tech stocks.
- Crypto Markets: Cryptocurrencies are known for their extreme price volatility. When cryptocurrencies like Bitcoin and Ethereum experience rapid price surges, it’s a classic example of FOMO in action.
In conclusion, the journey from fear to FOMO in the financial markets is a captivating one, reflecting the ebb and flow of human emotions and market sentiment. Fear, often triggered by external events, gives way to the allure of FOMO, driven by positive sentiment and technical indicators. As investors, understanding this transition is crucial for making informed decisions and navigating the complex world of finance.
Remember, one of the keys to success in financial markets is to strike a balance between caution and opportunity. Staying informed, analysing market conditions and indicators, and, most importantly, managing one’s emotions effectively. Investing is not just about numbers; it’s about understanding the emotional tide that moves the markets.
Sources: TradingView, Investopedia, Lazard Asset Management, CNBC, Corporate Finance Institute, Forbes, Morgan Stanley.
Piece Written by Mfanafuthi Mhlongo, Trive Financial Market Analyst
Disclaimer: Trive South Africa (Pty) Ltd, Registration number 2005/011130/07, and an Authorised Financial Services Provider in terms of the Financial Advisory and Intermediary Services Act 2002 (FSP No. 27231). Any analysis/data/opinion contained herein are for informational purposes only and should not be considered advice or a recommendation to invest in any security. The content herein was created using proprietary strategies based on parameters that may include price, time, economic events, liquidity, risk, and macro and cyclical analysis. Securities involve a degree of risk and are volatile instruments. Market and economic conditions are subject to sudden change, which may have a material impact on the outcome of financial instruments and may not be suitable for all investors. When trading or investing in securities or alternative products, the value of the product can increase or decrease meaning your investment can increase or decrease in value. Past performance is not an indication of future performance. Trive South Africa (Pty) Ltd, and its employees assume no liability for any loss or damage (direct, indirect, consequential, or inconsequential) that may be suffered from using or relying on the information contained herein. Please consider the risks involved before you trade or invest.