Apple Inc. (NASDAQ: AAPL) has navigated through volatile trading waters in the early months of the year, witnessing a 4.35% dip in its share price year-to-date. Despite this, its latest quarterly earnings report revealed impressive results. Revenue surged to $119.6 billion from the previous $117.2 billion, translating to earnings per share (EPS) of $2.18, up from $1.88 in the same quarter last year. Notably, iPhone sales, an area of concern in recent times, amounted to $69.7 billion, surpassing the previous $65.8 billion. Analysts foresee a gradual uptick in iPhone sales this year, particularly as demand stabilizes in crucial markets like China.
Although Apple’s 19.69% return over the past year trails behind some tech peers such as Nvidia (239.18%), Meta (163.77%), and Google (54.88%), it retains its position as the world’s second-largest company by market capitalization. Its impressive 10-year return of 847.08% underscores its consistent ability to deliver substantial returns to shareholders over the long haul.
Technical
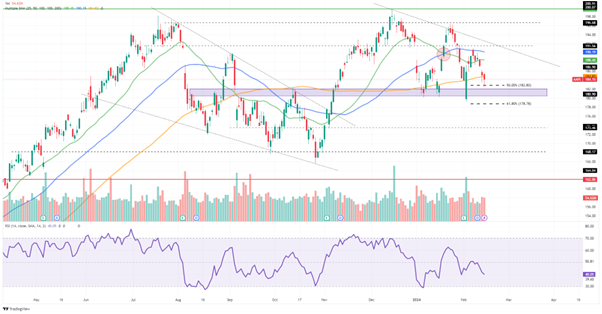
On the daily chart, a breakout occurred from a falling wedge pattern. However, that rally has reached a peak, resulting in choppy price action as the market anticipates its next directional trend. The crossing of the 25-SMA (green line) below the 50-SMA (blue line) suggests that the bears have gained the upper hand in the shorter term, confirmed by the continuous formation of lower highs.
The Fibonacci midpoint at $182.80 offers support just above a demand zone, where the price has found support for a retracement on multiple occasions. If the price action once again pivots off this support to form another lower high, a descending triangle could emerge, opening the potential for a breakdown toward $178.78, the 61.8% Fibonacci golden ratio in the longer term.
However, if the price pivots off the demand zone and breaches resistance at $191.56, it could signal a bullish reversal. The resistance at the peak of the prior uptrend around $196.68 could then become a psychological level of resistance for the buyers to clear. However, movement above this resistance could trigger a more sustainable rally higher toward $199.67.
Summary
Despite a beat in its latest earnings report, Apple has failed to provide the optimism necessary to catapult its share price. Support at $182.80 could underpin the price toward forming a new lower high, which could signal a potential breakdown of a triangle formation toward $178.78.
Sources: Koyfin, Tradingview, Reuters
Piece written by Tiaan van Aswegen, Trive Financial Market Analyst
Disclaimer: Trive South Africa (Pty) Ltd (hereinafter referred to as “Trive SA”), with registration number 2005/011130/07, is an authorised Financial Services Provider in terms of the Financial Advisory and Intermediary Services Act, 37 of 2002. Trive SA is authorised and regulated by the South African Financial Sector Conduct Authority (FSCA) and holds FSP number 27231. Trive Financial Services Ltd (hereinafter referred to as “Trive MU”) holds an Investment Dealer (Full-Service Dealer, excluding Underwriting) Licence with licence number GB21026295 pursuant to section 29 of the Securities Act 2005, Rule 4 of the Securities Rules 2007, and the Financial Services Rules 2008. Trive MU is authorized and regulated by the Mauritius Financial Services Commission (FSC) and holds Global Business Licence number GB21026295 under Section 72(6) of the Financial Services Act. Trive SA and Trive MU are collectively known and referred to as “Trive Africa”.
Market and economic conditions are subject to sudden change which may have a material impact on the outcome of financial instruments and may not be suitable for all investors. Trive Africa and its employees assume no liability for any loss or damage (direct, indirect, consequential, or inconsequential) that may be suffered. Please consider the risks involved before you trade or invest. All trades on the Trive Africa platform are subject to the legal terms and conditions to which you agree to be bound. Brand Logos are owned by the respective companies and not by Trive Africa. The use of a company’s brand logo does not represent an endorsement of Trive Africa by the company, nor an endorsement of the company by Trive Africa, nor does it necessarily imply any contractual relationship. Images are for illustrative purposes only and past performance is not necessarily an indication of future performance. No services are offered to stateless persons, persons under the age of 18 years, persons and/or residents of sanctioned countries or any other jurisdiction where the distribution of leveraged instruments is prohibited, and citizens of any state or country where it may be against the law of that country to trade with a South African and/or Mauritius based company and/or where the services are not made available by Trive Africa to hold an account with us. In any case, above all, it is your responsibility to avoid contravening any legislation in the country from where you are at the time.
CFDs and other margin products are complex instruments and come with a high risk of losing money rapidly due to leverage. You should consider whether you understand how these products work and whether you can afford to take the high risk of losing your money. Professional clients can lose more than they deposit. See our full Risk Disclosure and Terms of Business for further details. Some or all of the services and products are not offered to citizens or residents of certain jurisdictions where international sanctions or local regulatory requirements restrict or prohibit them.