There are many different chart pattern formations, each with its own rules, but these three reversal patterns should be taken note of especially in a trending market.
Reversal price patterns signal a change in the prevailing trend. Reversal patterns indicate periods where the uptrend or the downtrend is nearing completion. The current trend will pause, then head in a new direction as a new interest emerges from the other side (bull or bear).
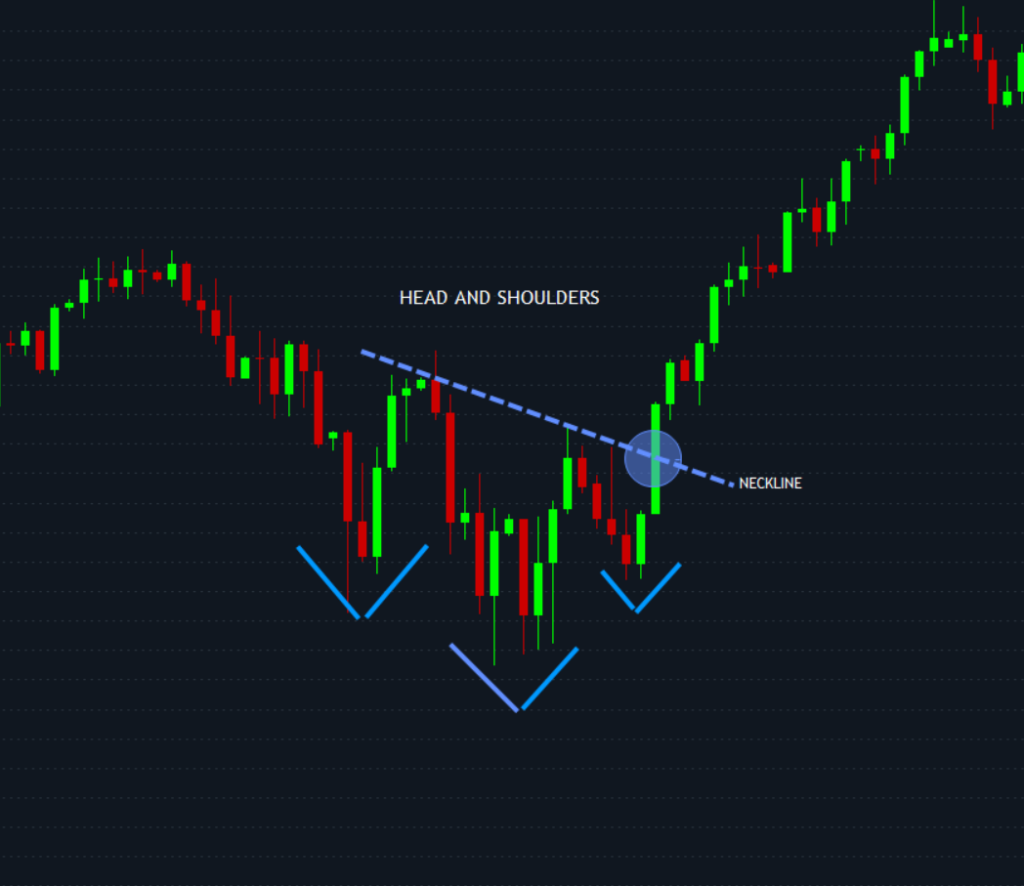
Head and Shoulders Pattern
The Head and Shoulders (H&S) pattern is a reversal pattern that can appear at the tops or bottoms in three pushes and is probably the most famous reversal pattern. The initial peak or shoulder is followed by a second and larger one, the head, and then a third push that mimics the first shoulder.
Horizontal or sloped trendlines can be drawn, connecting the peaks between the head and shoulders, as shown in the chart, and are known as the neckline. Volume may decline when the pattern develops and rise back as the price rise above (in the case of an H&S bottom) or down (in the case of an H&S top) the trendline.
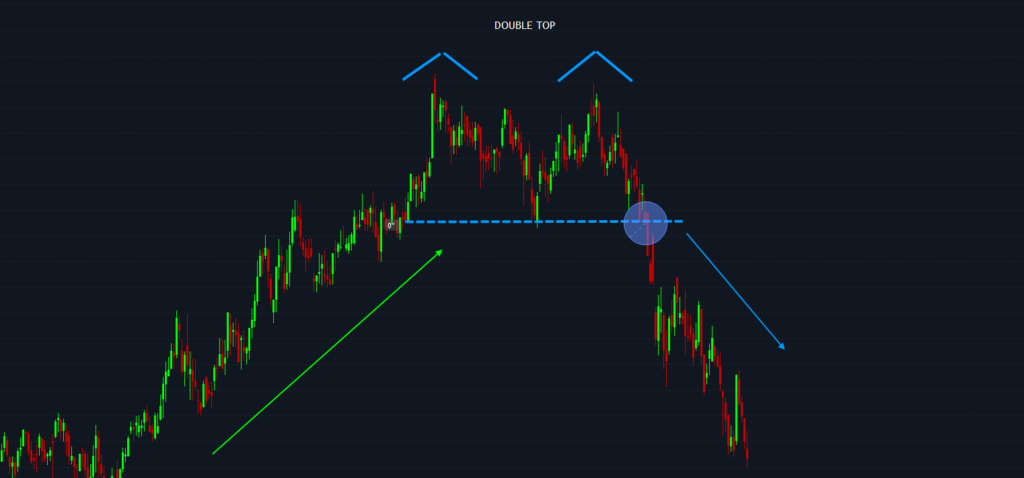
Double Top Pattern
The double top or double bottom is also a reversal pattern, signaling areas where the market has failed to break through a support or resistance level.
A double top often looks like the letter M and is an initial push-up of price to a resistance level followed by a second failed attempt, resulting in a trend reversal.
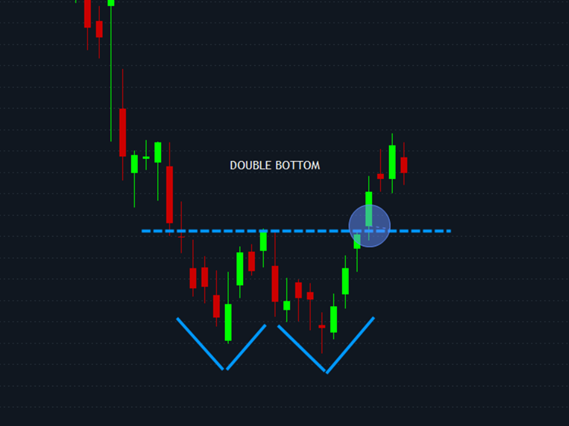
Double Bottom Pattern
A double bottom looks like a W formation and forms when the price action pushes to a support level, is denied, and makes a second attempt to breach the support level. This often results in a trend reversal as soon as the neckline of the pattern is broken and the price pushes higher. In most instances, the price action will retrace back to the breakout zone before trending higher again.