
Historically, the month of October has seen the occurrence of several significant stock market crashes, making it a month synonymous with a considerable loss in the value of stock markets.
What Is A Market Crash?
A stock market crash is a sudden, sharp, and significant decline in the overall value of a stock market index. It is characterized by a rapid and substantial drop in stock prices, often leading to financial panic, widespread selling, and a significant loss of investor confidence. A combination of factors such as economic downturns, investor sentiment, geopolitical events, or structural issues within financial markets typically causes them.
Some Of The Most Notable Market Crashes Include:
Black Tuesday (October 29, 1929): This was the infamous day that marked the start of the Great Depression. On this day, the Dow Jones Industrial Average plummeted by nearly 23%. Black Tuesday was triggered by a speculative stock market frenzy, overvaluation, and underlying economic weaknesses. A surge in panic selling led to a historic stock market crash, wiping out billions in value and triggering the Great Depression.
Black Monday (October 19, 1987): Often referred to as the “1987 Crash,” this was the largest single-day percentage loss in U.S. stock market history. The Dow Jones fell by over 22%. Black Monday was triggered by a combination of factors, including overvaluation and computerized trading, where sequential waves of programmed stock sell orders initiated a chain reaction, setting off a cascading impact in the market.
Asian Financial Crisis (October 1997): While not a single-day crash, the Asian Financial Crisis, which had a significant impact on global markets, intensified in October 1997. The Asian Financial Crisis was primarily caused by a combination of overleveraged financial systems, currency pegs that became unsustainable, speculative attacks on Asian currencies, and unsustainable levels of foreign debt. This led to a sudden loss of confidence in Asian currencies, triggering widespread financial turmoil and economic recession across the region.
Global Financial Crisis (September-October 2008): While the roots of the crisis began earlier, it escalated dramatically in September and October of 2008, culminating in the worst financial crisis since the Great Depression. A complex interplay of factors triggered the Global Financial Crisis. It was propelled by the bursting of the U.S. housing bubble, risky mortgage lending, widespread securitization, and a subsequent banking crisis. This led to a worldwide credit crunch, financial instability, and a severe global economic downturn. It took four years for the Dow Jones to recover from the crash fully.
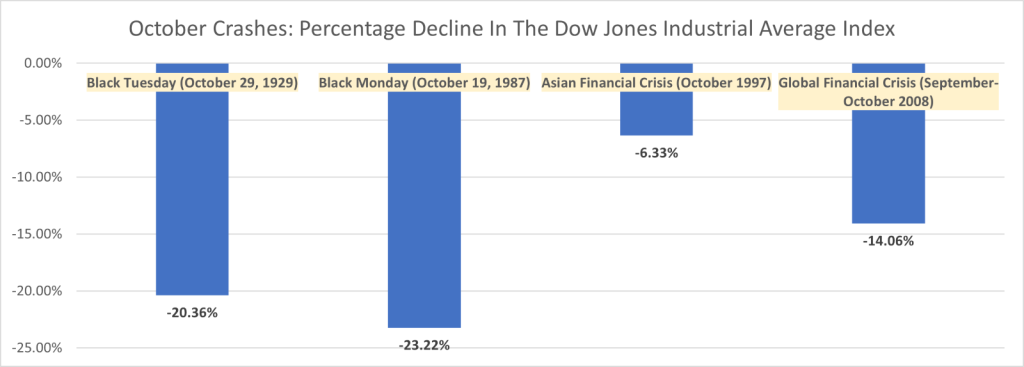
Source: Trive – Dow Jones Indices, Nkosilathi Dube
While these events occurred in October, it’s important to note that stock market crashes can and have happened in other months as well. Economic and geopolitical factors, along with market sentiment, play significant roles in shaping market movements. It’s crucial for investors to be aware of historical patterns but also to understand that past performance does not guarantee future results.
In contrast, October, historically perceived with caution in the stock market, has revealed surprising resilience over the past three decades. Schroders’ meticulous analysis of four major stock indices spanning from 1987 to 2018 illuminates a compelling narrative. Amongst the twelve months, October remarkably emerges as the third most robust performer, trailing only December and April, with a 69% frequency of growth.
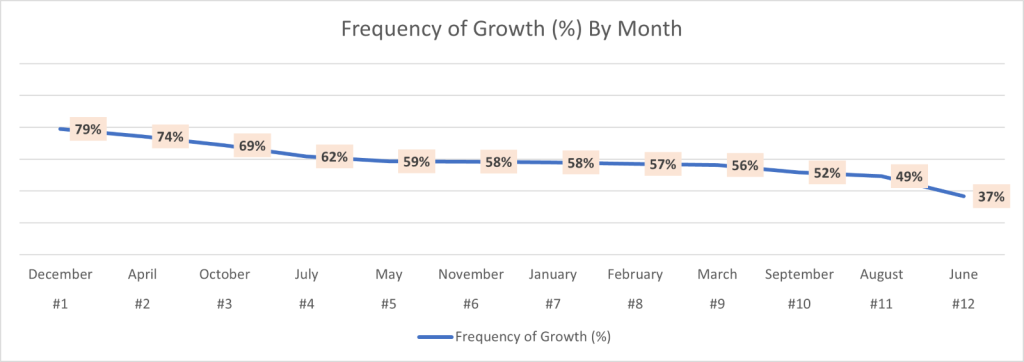
Source: Trive – Schroders, Visual Capitalist, Nkosilathi Dube
This revelation defies conventional wisdom, offering investors a fresh perspective on the month often associated with market volatility. The study delves into the performance of prominent indices, encompassing the:
- FTSE 100: representing the cream of London’s stock exchange, the top 100.
- MSCI World: a comprehensive gauge of over 1,000 companies across developed markets.
- S&P 500: a benchmark of America’s top 500 traded firms.
- Eurostoxx 50: an index spotlighting the elite 50 blue-chip stocks in the Eurozone.
Summary
The findings, encapsulated in percentages, portray the historical frequency of these indices ascending within specific months. October, once notorious for market crashes, has defied expectations. Schroders’ analysis reveals it as the third strongest month, challenging conventional wisdom. This resilience, with a 69% growth frequency, offers a fresh perspective. Understanding historical patterns is crucial, yet it’s vital to remember that past performance doesn’t guarantee future outcomes.
Source: Schroders, Visual Capitalist, Investopedia, Dow Jones Indices, TradingView
Disclaimer: Trive South Africa (Pty) Ltd, Registration number 2005/011130/07, and an Authorised Financial Services Provider in terms of the Financial Advisory and Intermediary Services Act 2002 (FSP No. 27231). Any analysis/data/opinion contained herein are for informational purposes only and should not be considered advice or a recommendation to invest in any security. The content herein was created using proprietary strategies based on parameters that may include price, time, economic events, liquidity, risk, and macro and cyclical analysis. Securities involve a degree of risk and are volatile instruments. Market and economic conditions are subject to sudden change, which may have a material impact on the outcome of financial instruments and may not be suitable for all investors. When trading or investing in securities or alternative products, the value of the product can increase or decrease meaning your investment can increase or decrease in value. Past performance is not an indication of future performance. Trive South Africa (Pty) Ltd, and its employees assume no liability for any loss or damage (direct, indirect, consequential, or inconsequential) that may be suffered from using or relying on the information contained herein. Please consider the risks involved before you trade or invest.