Unravelling the Dynamics of Stock Exchanges
Stock exchanges stand as the vibrant epicentres where the pulse of global financial prowess is felt. These dynamic marketplaces serve as hubs where trading titans, investors, and companies converge to trade equities, bonds, and securities. But beyond this surface, they are the heartbeat of economies, influencing standards of living, employment rates, and global economic strength.
What is a Stock Exchange?
A stock exchange is a pivotal marketplace where traders, buyers, and sellers converge to trade financial instruments like stocks, ETFs, and bonds. These exchanges offer a glimpse into a nation’s economic health, acting as a barometer of its financial vigour. Traditionally, they were physical buildings but have swiftly shifted to robust online platforms. Yet, their significance remains paramount, boasting market capitalizations worth trillions of dollars.
A stock exchange embodies various critical functions:
- Trading Platform: It acts as a regulated arena where trades occur under established guidelines.
- Listing and IPOs: Companies list their shares on exchanges through a listing process, offering them to the public via Initial Public Offerings (IPOs).
- Price Discovery: The continuous trading dynamics determine market prices, shaping supply and demand equilibrium.
- Market Regulation: Enforcing listing requirements and monitoring trades to maintain market integrity.
- Liquidity and Indices: Providing liquidity for traders and calculating market indexes to track performance.
- Clearing and Surveillance: Ensuring trade verification and monitoring to prevent fraudulent activities.
Delving into the Top 10 Global Stock Exchanges
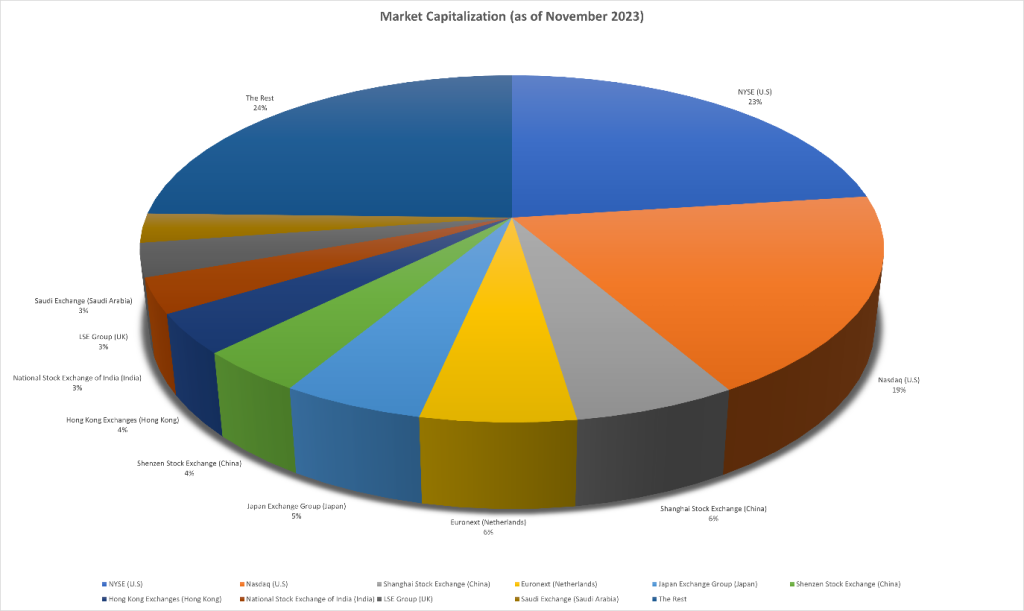
Embarking on our exploration, we find ourselves amidst a diverse array of stock exchanges, each wielding its unique influence. As of November 2023, the top 10 global stock exchanges boast market capitalizations that collectively eclipse the $80 trillion mark, with the global stock exchange market valued at a combined $110.2 trillion.
At the zenith sits the New York Stock Exchange (NYSE), towering with a staggering market cap of $25.24 trillion, followed closely by the tech-savvy Nasdaq at $20.58 trillion. The Shanghai Stock Exchange, Euronext, and the Japan Exchange Group complete the top five, with market caps exceeding $5 trillion each.
Table 1: Top 10 Largest Stock Exchanges by Market Capitalization as Of 3 November 2023
| Global Rank | Stock Exchange (Country) | Market Capitalization (August 2023) |
| 1 | NYSE (U.S.) | $25.24 T |
| 2 | Nasdaq (U.S.) | $20.58 T |
| 3 | Shanghai Stock Exchange (China) | $6.6 T |
| 4 | Euronext (Netherlands) | $6.26 T |
| 5 | Japan Exchange Group (Japan) | $5.75 T |
| 6 | Shenzen Stock Exchange (China) | $4.38 T |
| `7 | Hong Kong Exchanges (Hong Kong) | $4.1 T |
| 8 | National Stock Exchange of India (India) | $3.59 T |
| 9 | LSE Group (U.K.) | $3.42 T |
| 10 | Saudi Exchange (Saudi Arabia) | $3.01 T |
| The Rest | $24.8 T |
Journey into the Top Five Giants: Diving deeper into the titans shaping the financial landscape:
Source: Trive Financial Services Malta, Mfanafuthi Mhlongo.
1. New York Stock Exchange (NYSE) – Market Capitalization ≈ $25.24 trillion
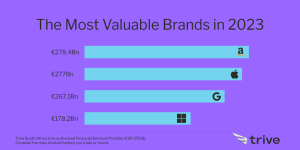
Undoubtedly, the NYSE reigns supreme, a colossus with a historical lineage dating back to 1792. Anchored in Wall Street, its $25.24 trillion market cap attests to its stringent standards, regulatory prowess, and global prominence. It houses mammoth corporations like Apple, Microsoft, and Berkshire Hathaway, painting a vivid picture of its colossal presence.
2. Nasdaq – Market Capitalization ≈ $20.58 trillion
The Nasdaq, born in 1971, stands as a tech-savvy giant. Operating electronically and boasting a $20.58 trillion market cap, it’s the go-to platform for technology-driven entities like Amazon, Google (Alphabet), and Facebook (Meta Platforms). Its allure lies in fostering innovation and nurturing high-growth enterprises.
3. Shanghai Stock Exchange (SSE) – Market Capitalization ≈ $6.6 trillion
A key player in China’s financial ascent, the SSE holds a robust $6.6 trillion market cap. Driving China’s economic growth it magnetizes companies, both domestic and international. The SSE fuels China’s thriving middle-class participation in the stock market, amplifying its stature.
4. Euronext – Market Capitalization ≈ $6.26 trillion
Spanning multiple European countries, Euronext’s $6.26 trillion market cap makes it a linchpin in Europe’s financial ecosystem. As a gateway for varied industries seeking European investors, its diverse listings bolster its prominence.
5. Japan Exchange Group (JPX) – Market Capitalization ≈ $5.75 trillion
Japan’s financial stronghold, with a market cap of $5.75 trillion, the JPX embodies stability and innovation. Hosting globally recognized companies like Toyota, Sony, and SoftBank, it serves as a magnet for international investors seeking a piece of Japan’s thriving market.
Summary: The Clash of Financial Titans
In the mesmerizing arena of global stock exchanges, these giants etch their influence, dictating market narratives and charting the course of economic prowess. From the stalwart NYSE to the tech-centric Nasdaq, each exchange boasts a unique narrative, underlining the mosaic of the financial world. Their colossal figures don’t merely reflect market size; they mirror economic vigour, innovation, and investor confidence.
The battle amongst these titans isn’t just about market caps; it’s a reflection of economic vigour, innovation, and investor confidence in an ever-evolving financial landscape. As the world shifts and economies surge, these stock exchanges continue to shape our global economic narrative, each a force to be reckoned with, a testament to the enduring power of finance in the modern world.
Sources: Visual Capitalist, Statistica, Scripbox, Investopedia, Corporate Finance Institute, Global Finance Magazine, DW, Goldman Sachs.
Piece Written by Mfanafuthi Mhlongo, Trive Financial Market Analyst
Disclaimer: Trive South Africa (Pty) Ltd, Registration number 2005/011130/07, and an Authorised Financial Services Provider in terms of the Financial Advisory and Intermediary Services Act 2002 (FSP No. 27231). Any analysis/data/opinion contained herein are for informational purposes only and should not be considered advice or a recommendation to invest in any security. The content herein was created using proprietary strategies based on parameters that may include price, time, economic events, liquidity, risk, and macro and cyclical analysis. Securities involve a degree of risk and are volatile instruments. Market and economic conditions are subject to sudden change, which may have a material impact on the outcome of financial instruments and may not be suitable for all investors. When trading or investing in securities or alternative products, the value of the product can increase or decrease meaning your investment can increase or decrease in value. Past performance is not an indication of future performance. Trive South Africa (Pty) Ltd, and its employees assume no liability for any loss or damage (direct, indirect, consequential, or inconsequential) that may be suffered from using or relying on the information contained herein. Please consider the risks involved before you trade or invest.