
Navigating the complexities of financial markets can be a formidable undertaking, but the arsenal of tools available to traders serves as a valuable ally in making informed decisions. Among these tools, pivot points emerge as a widely embraced technical indicator, offering insights into the prevailing market trends across various timeframes.
So, what exactly are pivot points, and how are they derived?
These technical indicators draw upon data from the previous day’s trading activities, calculated as the average of the intraday high, intraday low, and closing price. Unlike dynamic oscillators, pivot points stand as static markers on the technical graph, remaining unchanged throughout the trading day. This stability empowers traders to strategically plan and execute trades well in advance. In addition to the pivot point, which could provide traders with a level on the chart at which sentiment could shift from bullish to bearish, or vice versa, should the price cross that level, there are additional support and resistance levels that are projected from the pivot point calculation. These are indicated as S1 (for support) and R1 (for resistance) and indicate levels at which traders could expect potential support or resistance to be found. The calculations for these support and resistance levels are as follows:
Pivot Point = (Previous High + Previous Low + Previous Close) / 3
S1 = (Pivot Point x 2) – Previous High
R1 = (Pivot Point x 2) – Previous Low
These calculations could be further extended, meaning lower support levels and higher resistance levels could also be projected from these calculations, which are indicated as S2 and R2 on the chart. The calculations for these are as follows:
S2 = Pivot Point – (Previous High – Previous Low)
R2 = Pivot Point + (Previous High – Previous Low)
How are Pivot Points Generally Used in Trading?
Now that we know how these levels are calculated and what they represent let us look at a practical example on a chart of how these indicators could be used. Generally, if the price trades above the pivot point on a subsequent day, it indicates ongoing bullish momentum. Conversely, trading below the pivot point could indicate ongoing bearish momentum. The chart below demonstrates the bullish momentum on the 4H chart of the EURUSD currency pair using the daily pivot points from the prior day’s trading. The daily pivot point is established at 1.069, and the session opened above this level, indicating potential bullish momentum. The currency pair exceeded the first resistance level (R1) at 1.071 but met sellers at the higher resistance (R2) at 1.073. Therefore, with the price trading above the pivot point, traders could look toward R1 and R2 as potential resistance levels or take-profit levels in a long trade to benefit from the potential bullish momentum indicated by the price trading above the pivot.
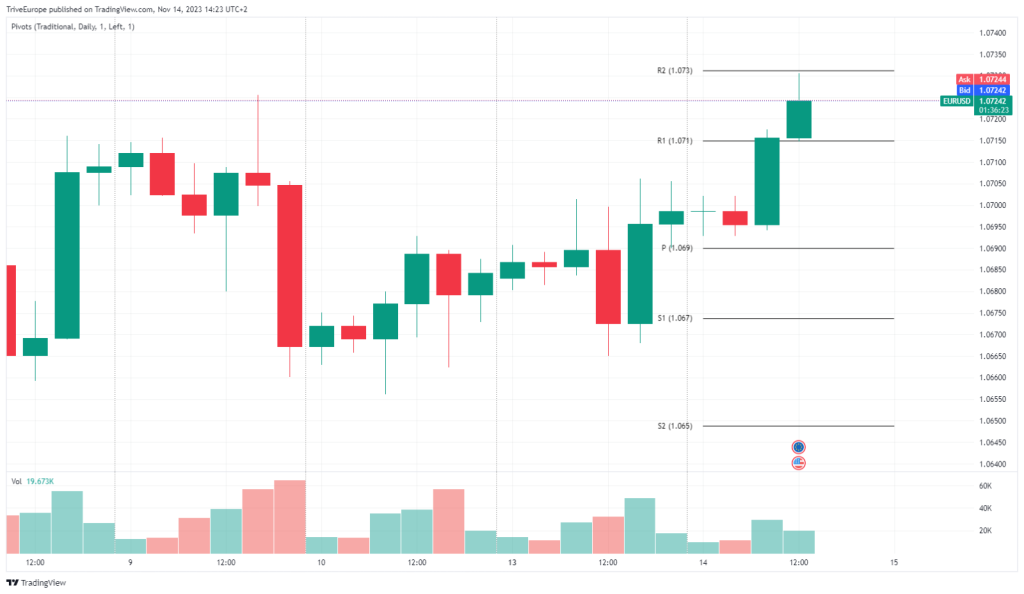
Source: Trive – Tradingview, Tiaan van Aswegen
Conversely, the chart below indicates a different scenario for the EURGBP currency pair on the 4H chart. While the price opened below the pivot point of 0.872, it has subsequently broken through to the upside, signalling a potential momentum reversal to the upside. In a situation like this, a trader would typically seek to benefit from the prevailing trend, with a long position, with resistance at 0.873 (R1) acting as a potential take profit. In contrast, 0.870 (S1) could serve as a stop-loss level to prevent additional losses should the theory not play out.
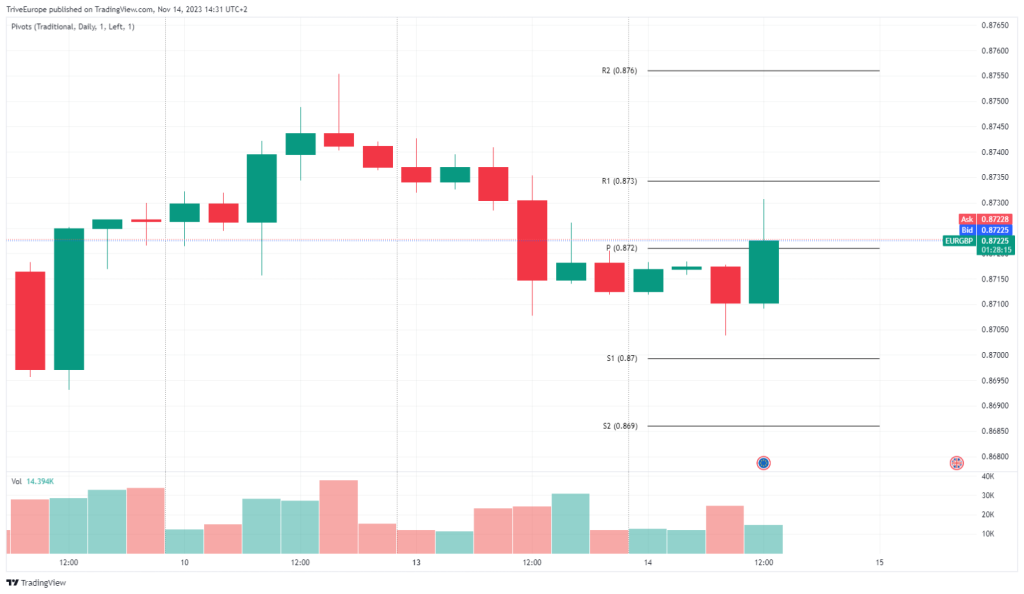
Source: Trive- Tradingview, Tiaan van Aswegen
Pivot points are also often used in conjunction with other trading indicators, and pivot points that overlap with other indicators, such as moving averages of Fibonacci retracement or extension ratios, could provide support and resistance levels that are potentially stronger than a standalone pivot point. However, as with any other indicators, it is worth noting that there are no guarantees that the theory around the pivot points would play out, as the market is unpredictable, even to the best of traders.
Summary
In the complex and challenging world of trading, various tools are available to traders to assist them in making informed decisions. Pivot points are one of these indicators, which could give day traders some insight into the prevailing trends in the market on different timeframes. Used in conjunction with other technical indicators that align with the trader’s strategy, pivot points could be a valuable tool in a trader’s arsenal.
Sources: Corporate Finance Institute, Tradingvew, Investopedia
Piece written by Tiaan van Aswegen, Trive Financial Market Analyst
Disclaimer: Trive South Africa (Pty) Ltd, Registration number 2005/011130/07, and an Authorised Financial Services Provider in terms of the Financial Advisory and Intermediary Services Act 2002 (FSP No. 27231). Any analysis/data/opinion contained herein are for informational purposes only and should not be considered advice or a recommendation to invest in any security. The content herein was created using proprietary strategies based on parameters that may include price, time, economic events, liquidity, risk, and macro and cyclical analysis. Securities involve a degree of risk and are volatile instruments. Market and economic conditions are subject to sudden change, which may have a material impact on the outcome of financial instruments and may not be suitable for all investors. When trading or investing in securities or alternative products, the value of the product can increase or decrease meaning your investment can increase or decrease in value. Past performance is not an indication of future performance. Trive South Africa (Pty) Ltd, and its employees assume no liability for any loss or damage (direct, indirect, consequential, or inconsequential) that may be suffered from using or relying on the information contained herein. Please consider the risks involved before you trade or invest.