Welcome to Reading Financial Statements 101. We have great news for you!
You do not have to be an expert to read financial statements, nor do you have to be from the industry to use them for your benefit. However, if you want to be Warren Buffet or Charlie Munger, analysing financial statements for decades (maybe centuries? Shhh) could put you at an advantage. Let’s explore what they are and how to read them.
What are Financial Statements?
Financial Statements are reports that summarise a company’s financial activities and performance. Accountants typically prepare these quarterly and annually to keep track of a company’s performance throughout.
Analysts look at three main types of financial statements: the Income Statement, Balance Sheet and Cash Flow Statement. Each one has a different purpose, and they are most popularly presented in Annual Reports, which give insight into a company’s operations and financial standing yearly.
What is Their Purpose?
Investors and lenders use financial statements to measure a business’s performance, financial health and earnings potential. All these factors are essential as investors and lenders look to earn from their investments or loans respectively. Financial statements provide a snapshot of a company’s revenues, expenses, profitability, cash, asset, and debt holding and assist in capital budgeting and investment decisions.
Types of Financial Statements:
There are three main types of financial statements which we will explore below:
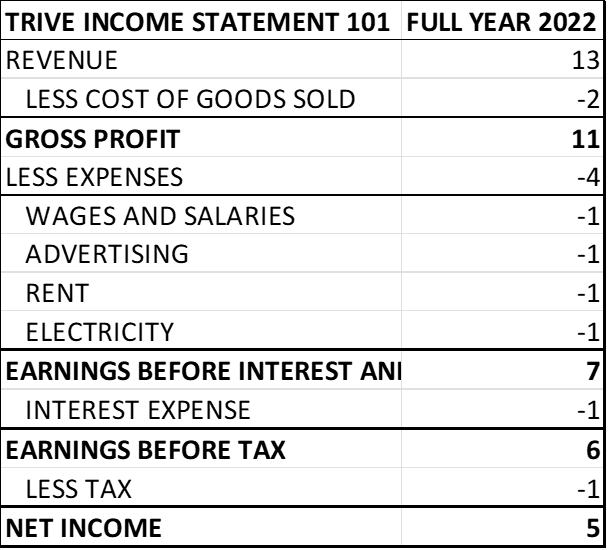
Income Statement
The income statement presents revenues generated from sales, expenses incurred from revenue generation (including other costs like interest on borrowings and taxes) and income generated after deducting expenses from revenue. Two key things to consider in the financial statement are the top line (revenue) and bottom lines (net income) and how everything in between affects the bottom line. In simple terms, the income statement is Revenue less Cost of Goods Sold, Less Expenses, and there we have it, the company’s profits or loss if it was a bad year.
Balance Sheet
The Balance Sheet reflects the company’s assets (what they own), liabilities (what they owe) and equity (ownership of the company). Assets and liabilities are generally split in two, Non-Current and Current. Non-current refers to the longer-term Assets or liabilities, typically held for twelve months and over. Non-current assets can include property, plant and equipment, which are used to generate revenue for the business. Non-current liabilities are debts that a company owes and are generally used to fund expansion, like buying equipment. Current assets, like inventory or short-term debtors, can be quickly converted into cash. Current liabilities include short-term creditors and are generally due within twelve months. In simple terms, Assets are equal to Liabilities plus Equity (the Accounting Equation).

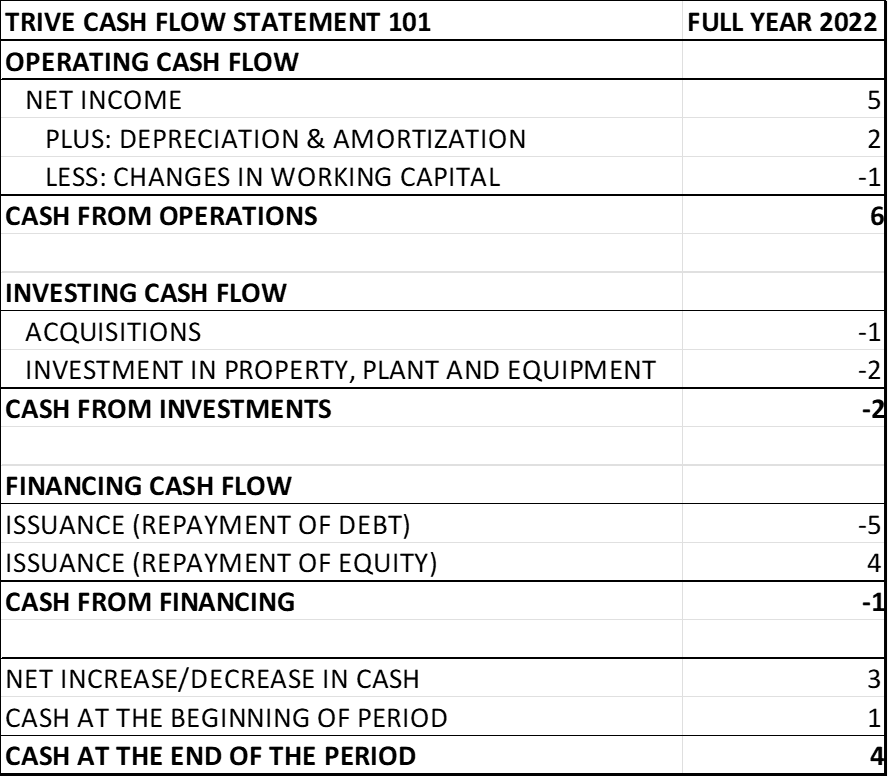
Cash Flow Statement
The Cash Flow Statement measures the cash generated in a given period and tracks all transactions involving cash coming in and going out of the company. This report shows how much cash is available to the company to fund its day-to-day operations and meet its short-term obligations. The cash flow statement is typically split into three sections, Cash generated from operation (from running the business), Cash generated from financing activities (from investors or lenders), and Cash generated from investing activities (from the company’s long-term investments).
Analysing Financial Statements
Reading financial statements is all about comparative analysis. It could be comparing one year to the next or of individual line items to another line item in the financial statements.
Vertical Analysis
Vertical Analysis involves looking at individual line items compared to another line item within the same financial statement. It is usually viewed as the percentage of sales. For example, an analyst could look at the net income as a percentage of sales to determine how much the company makes per unit of sale. This approach determines the proportion of one thing to another and is normally used for a single reporting period (e.g., yearly). For example, vertical analysis would use a line item as a percentage of sales in the income statement. At the same time, the balance sheet could look at a separate line item as a percentage of assets. It assists in realising the correlation between two things.
Horizontal Analysis
Horizontal analysis is used to evaluate the company’s performance over time and can be used over multiple reporting periods. This approach is ideal for identifying trends over time and how they change. Analysts or investors can discern what has driven a company’s financial performance over a period of time, while relative changes and seasonality are easy to see with the eye.
What To Look For
Generally, good companies can generate sales growth and bolster their net income year-over-year. The income statement can assist in determining whether a company is profitable or not. In addition, high levels of borrowing tend to affect a company’s income as it leads to higher interest expenses. Therefore, debt and equity ratios can determine the health of a company’s capital structure. Lastly, cash flows are required to keep the company’s lights on. If a company cannot generate cash, there surely is a problem.
This material (whether or not including any opinion) is provided for information purposes only and does not consider any individual’s personal circumstances or investment objectives. Nothing contained in this material is or should be considered to be financial, investment or other advice.
Disclaimer: Trive South Africa (Pty) Ltd, Registration number 2005/011130/07, and an Authorised Financial Services Provider in terms of the Financial Advisory and Intermediary Services Act 2002 (FSP No. 27231). Any analysis/data/opinion contained herein are for informational purposes only and should not be considered advice or a recommendation to invest in any security. The content herein was created using proprietary strategies based on parameters that may include price, time, economic events, liquidity, risk, and macro and cyclical analysis. Securities involve a degree of risk and are volatile instruments. Market and economic conditions are subject to sudden change, which may have a material impact on the outcome of financial instruments and may not be suitable for all investors. When trading or investing in securities or alternative products, the value of the product can increase or decrease meaning your investment can increase or decrease in value. Past performance is not an indication of future performance. Trive South Africa (Pty) Ltd, and its employees assume no liability for any loss or damage (direct, indirect, consequential, or inconsequential) that may be suffered from using or relying on the information contained herein. Please consider the risks involved before you trade or invest.