Trading indicators are vital tools for traders, offering insights into market trends, momentum, volatility, and potential entry or exit points.
Traders often use a combination of these indicators to confirm signals and make informed trading decisions. Understanding each indicator’s strengths and weaknesses and how they complement different trading strategies and market conditions is crucial. Below, we explore some common types of Trend Indicators:
- Trend Indicators:
- Moving Averages
Moving averages, essential tools in trading, offer insight into market trends by smoothing out price data over a specified period. Simple moving averages (SMAs) and exponential moving averages (EMAs) diverge in calculation methods: SMAs evenly weigh data points, while EMAs prioritise recent prices, reacting quicker to changes.
In forex, these moving averages help traders comprehend market directions. SMAs, depicting broader trends, suit long-term strategies, while EMAs, responsive to recent shifts, assist in short-term decisions. They don’t predict future prices but aid in identifying potential entry or exit points.
For example, combining a 50-day SMA (red line) and a 20-day EMA (blue line). When the 20-day EMA crosses above the 50-day SMA, signalling a short-term upturn in a longer-term uptrend, it may suggest a potential for a trading opportunity. Utilised cautiously, these indicators contribute to a comprehensive trading strategy, enhancing traders’ understanding of market dynamics.

- The Moving Average Convergence Divergence (MACD):
This is a versatile indicator, revealing the underlying momentum within trends as it showcases the relationship between two moving averages. Comprising a fast line (MACD line) and a slow line (signal line), it visualises the convergence and divergence of these averages.
The MACD can act as a compass for market momentum in forex trading, pinpointing potential trend changes. For example, when the MACD line (blue line) crosses above the signal line (black line), signalling a bullish crossover, it could suggest a strengthening upward momentum; conversely, a bearish crossover could indicate a potential downward momentum.
The MACD embodies the principle that momentum often precedes price movements, providing traders with insights into potential shifts. For instance, when the MACD line crosses above the signal line after being below it, traders might interpret it as a trading signal, anticipating a continuation of a bullish trend. This indicator doesn’t forecast prices but aids traders in understanding momentum shifts, enhancing their strategies to navigate market fluctuations effectively.

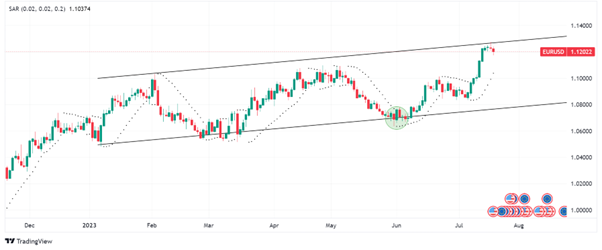
- Parabolic SAR (Stop and Reverse)
The Parabolic SAR (Stop and Reverse) indicator is a trend-following tool in trading that helps identify potential reversal points in price direction. It places dots either above or below an asset’s price, illustrating possible trend shifts. When the dots are below the price, it suggests an upward trend; when above, a downward trend.
In forex, this indicator aids traders by offering visual cues about potential trend changes. For instance, when the dots switch from being above to below the price, it might signal a shift from a downtrend to an uptrend, potentially indicating a trading opportunity.
The Parabolic SAR aligns with the theory that trends persist until a reversal, emphasising the importance of recognising trend changes for informed decision-making. While it doesn’t predict precise market movements, it contributes to traders’ comprehension of potential trend shifts, enhancing their strategies for navigating market fluctuations.
Summary
Understanding indicators such as moving averages, MACD, and Parabolic SAR assists in analysing market trends and identifying entry/exit points. While valuable for refining strategies, it’s crucial to remember that they are among many tools and do not predict prices. Trading indicators offer insights into market dynamics but aren’t predictive of price movements.
Sources: Corporate Finance Institute, Investopedia, TradingView
Piece Written By Nkosilathi Dube, Trive Financial Market Analyst
Disclaimer: Trive South Africa (Pty) Ltd, Registration number 2005/011130/07, and an Authorised Financial Services Provider in terms of the Financial Advisory and Intermediary Services Act 2002 (FSP No. 27231). Any analysis/data/opinion contained herein are for informational purposes only and should not be considered advice or a recommendation to invest in any security. The content herein was created using proprietary strategies based on parameters that may include price, time, economic events, liquidity, risk, and macro and cyclical analysis. Securities involve a degree of risk and are volatile instruments. Market and economic conditions are subject to sudden change, which may have a material impact on the outcome of financial instruments and may not be suitable for all investors. When trading or investing in securities or alternative products, the value of the product can increase or decrease meaning your investment can increase or decrease in value. Past performance is not an indication of future performance. Trive South Africa (Pty) Ltd, and its employees assume no liability for any loss or damage (direct, indirect, consequential, or inconsequential) that may be suffered from using or relying on the information contained herein. Please consider the risks involved before you trade or invest.