Knowing the difference between a trading strategy and a trading style is the one thing that differentiates the most successful traders from a trader that constantly holds losing positions within the market. Understanding your trading style and strategy is very important in formulating your trading plan, a set of rules that guide when and how a trader enters and exits different positions, as well the overall cash management techniques for each trade.
A trading style is a plan on how frequently a trader trades and how long the position on those particular trades will be kept open. Thus, a trading style differentiates a day trader, who is a trader who looks to use the intraday fluctuation in shares or commodity prices to make a profit from a longer-term trader. On the other hand, a trading strategy is a precise methodology that encompasses analyses and identification of specific market conditions and points for the execution of trades.
Several trading strategies can be employed to execute trades within the different markets, some of which are discussed below.
Trend Trading
Trend trading is arguably the most popular trading strategy amongst traders and investors because it can be applied across multiple markets, from forex to stock trading. The basis of this strategy involves using technical indicators and technical analysis to identify and forecast the direction of the market momentum.
With this strategy, the trader believes that they can use the trend to identify the market’s movement and take a position to benefit from it. If the trader believes that the securities price trend will continue upward and reach higher highs, then the trader will take a long position. If they believe the downward trend will persist and achieve lower lows, the trader will take a short position.
This trading strategy can be implemented using several techniques depending on the trader’s indicator and price action methods. Some of the more popular trend trading strategies are:
- Moving Averages
A moving average is a technical indicator that helps indicators generate trading signals and helps them determine the direction of the trend of a particular security. As the moving average reflects the previous security price, traders can use the moving average to speculate on the possible direction of the security price.
- Momentum Indicators
Momentum indicators, such as the Relative Strength Index (RSI) and Average Directional Index (ADX), are technical indicators used to determine the relative strength or weakness of a security’s price. With this indicator, the consensus is that a trader would enter a long position if they believe the security is trending with strong momentum and exit the long position if the security is losing momentum.
Range Trading
Range trading strategy is defined as a strategy that can identify the range the market is bound by. The market moves consistently between two prices or levels for a definitive period.
Like the trend trading strategy mentioned above, this type of strategy can also be implemented through several techniques dependent on the type of technical indicators utilised. Some of the methods include:
- Range Trading with Pivot Points
Pivot points help traders determine the level of entry and profit-taking by defining the market sentiment and the market’s overall trajectory by identifying trends and reversals. Pivot points indicators help predict support and resistance levels which can be used to predict the optimal entry and exit points of a particular trade.
Using this strategy will entail that a trader takes a long position if the security’s price level is nearing or breaking through the support level and holds a short position if the security’s price level is approaching the resistance level.
- Range Trading with Volatility Indicators
Like the pivot points, when trading using this strategy, the trader would use volatility indicators such as Bollinger bands and true average range (ATR) to determine optimal entry and exit points for trades.
Breakout Trading
A breakout is a phenomenon where a price of an underlying asset moves beyond a certain price level, either breaking through the support level or above and moving past the resistance price level. Thus, traders who employ this particular strategy use all the resources to identify patterns and enter a trade as soon as the price breaks out of the range.
As a trader trading on the breakout, one would enter a trade as soon as the price breaches the resistance level. Breakout traders believe that if the price breaches the resistance level, it will continue its trajectory due to its momentum.
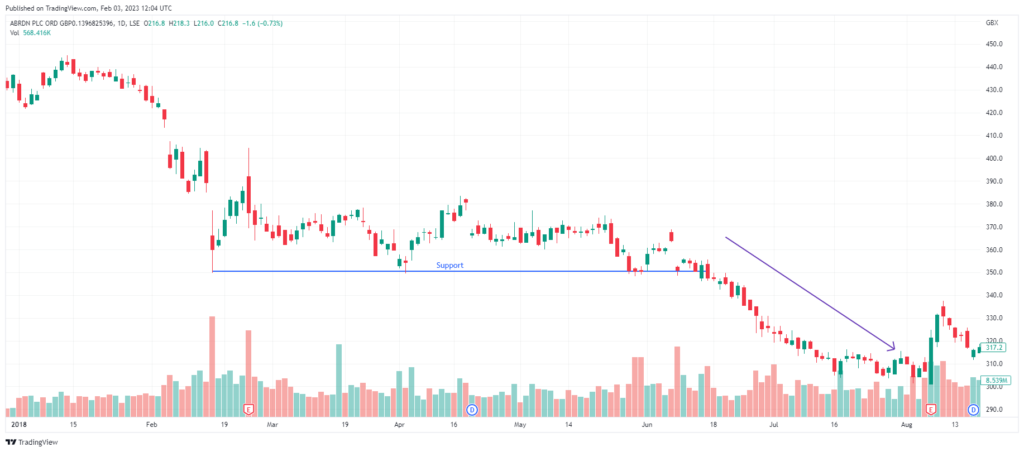
For example, it is the case of Standard Life Aberdeen, which was formed after the merger between Standard Life and Aberdeen Asset Management, completed in 2017. The company’s stock failed to be below the 350 price level, thus forming a support level. In June 2018, the support was broken, accompanied by the increase in volume; hence the breakout occurred, and a breakout trader would have taken a bearish position to gain from this movement.
Reversal Trading
Many traders and investors see a reversal trading strategy as a strategy that is the polar opposite of the trend trading strategy, as a reversal trading strategy seeks to take advantage of the reversal of the trend in the market. A reversal is a turnaround in the movement of the stocks or asset price, where an upward trend turns downward and vice versa.
A reversal trader would use this strategy to enter into a short position in a bullish trend (uptrend) and a long position (buy) in a bearish trend (downtrend) as they believe that that particular trajectory will be turning soon.
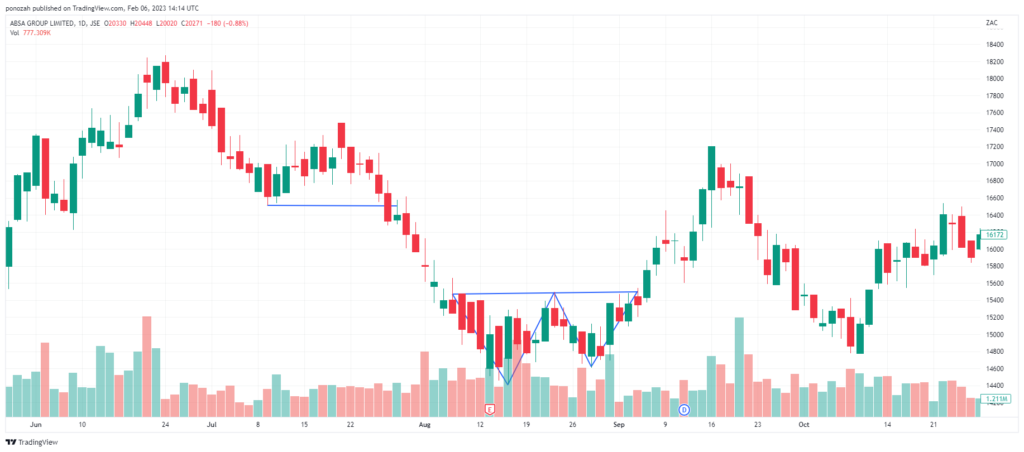
Example: The Absa Group’s stock price breaks out of a double bottom (the “W” between August and September), which suggests that the bearish downward trajectory that started when the stock price broke below the 26th of August is reversing into a new upward trend. With this analysis, a reverse trader would have bought the stock at around 14500.
Gap Trading
A gap in trading is a change. Security can either gap or down, depending on the relationship between two consecutive price levels. If the high of the current candle stick is lower than the low of the preceding candle stick, then the security is gaping down, and if the low of the current candle stick is higher than the high of the prior candle stick, then we have a gap up.
These strategies help traders take full advantage of the gaps caused by price differences between the opening and closing price levels. There are generally four different types of trade that gap traders usually execute depending on the kind of gap the security experiences, as these are believed to signal different market conditions.
- Exhaustion gaps: These particular gaps occur near the end of a pattern and indicate the security’s last effort to reach the price highs or lows. As these gaps tend to be filled quickly due to the lack of momentum accompanied by this type of gap, the consensus is that traders who identify these exhaustion gaps in a mature trend might look to exit their trading positions or wait for further confirmation of a trend reversal.
- Breakaway gaps: Measured gaps also occur near the end of a pattern, indicating the beginning of a trend and signifying a significant change in investor sentiments. As these suggest that a new trend is forming, a trader would benefit from taking a long position if the upward trend is forming and a short position if a downward trend is forming.
- Continuation gaps: These gaps occur when there is an increased trading activity, supply and demand that occur in the middle of the price pattern and not near the end like the breakaway gaps. The best position that the trader can take is the same as the market or trend.
- Common gaps: As the name suggests, these represent where the price has gapped, and nothing happens. After the price gap, there is usually no significant evidence of any new highs or new lows, and it tends to close with a few after the occurrence.
Which strategy is the best?
No strategy can serve every trader’s needs every time and all the time. The type of strategy suitable for a trader varies from trader to trader and depends on numerous factors such as trading frequency and market timing strategy.
Sources: Investopedia, TradingView, Tradingfuel, Trading strategy guide, Corporate Finance Institute.
Disclaimer: Trive South Africa (Pty) Ltd, Registration number 2005/011130/07, and an Authorised Financial Services Provider in terms of the Financial Advisory and Intermediary Services Act 2002 (FSP No. 27231). Any analysis/data/opinion contained herein are for informational purposes only and should not be considered advice or a recommendation to invest in any security. The content herein was created using proprietary strategies based on parameters that may include price, time, economic events, liquidity, risk, and macro and cyclical analysis. Securities involve a degree of risk and are volatile instruments. Market and economic conditions are subject to sudden change, which may have a material impact on the outcome of financial instruments and may not be suitable for all investors. When trading or investing in securities or alternative products, the value of the product can increase or decrease meaning your investment can increase or decrease in value. Past performance is not an indication of future performance. Trive South Africa (Pty) Ltd, and its employees assume no liability for any loss or damage (direct, indirect, consequential, or inconsequential) that may be suffered from using or relying on the information contained herein. Please consider the risks involved before you trade or invest.