Advanced Micro Devices (AMD) delivered a mixed bag in its Q4 earnings report. It delivered in-line fourth-quarter earnings fuelled by surging data center revenue, beating on the bottom line but missing on revenue estimates, triggering a 9% after-the-bell plunge.
The data center segment, AMD’s growth engine, continued its impressive run with a 38% year-over-year surge in revenue, exceeding expectations. This affirms the company’s strong position in the cloud computing space, fuelled by AI adoption and high-performance computing demand. Client revenue surged 62%, driven by robust sales of AMD Ryzen processors. This segment, a key beneficiary of the work-from-home trend, shows continued resilience despite broader market concerns.
However, the gaming segment faltered, with revenue declining 17%. This weakness reflects a normalization of demand after a pandemic-driven surge and could raise concerns about future performance in a potentially saturated market.
Technical
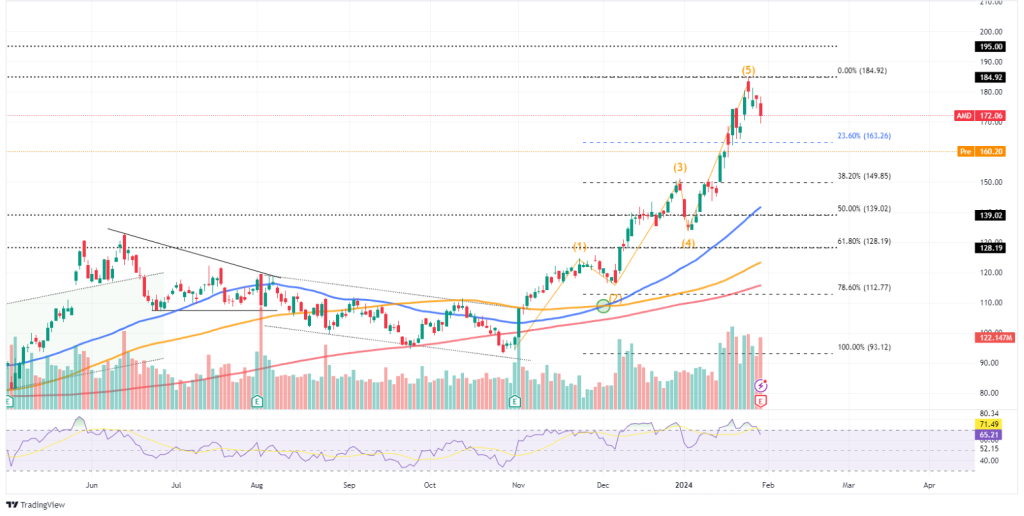
The daily chart shows that despite the post-earnings dip, AMD’s price action remains above its key 50-SMA (blue line), 100-SMA (orange line), and 200-SMA (red line), indicating long-term bullish sentiment. However, the Relative Strength Index (RSI) stands at 65.21, flirting with overbought levels. This suggests the recent sell-off might be a technical correction rather than a fundamental shift.
With the price action ($160.20) looking to open below the 23.60% Fibonacci retracement level ($163.26) following an over 9% gap down, the 23.60% Fibonacci retracement level could play a key part in determining the share’s direction in the upcoming sessions. A push back above the 23.60% Fibonacci retracement level would leave the all-time high of $184.92 firmly in play. A break above the all-time high on significant volume could confirm the bullish momentum, leaving the $195.00 price level as the next likely level of significance in the short term.
However, a sustained push below the 23.60% Fibonacci retracement level would leave the 38.20% Fibonacci retracement level ($149.85) as the next significant support lower. A successful bridge of the 38.20% Fibonacci retracement level could trigger a sell-off, with the 50.00% Fibonacci retracement level ($139.02) and 61.80% Fibonacci retracement level ($128.19) acting as the next significant levels lower.
Summary
AMD’s post-earnings dip raises concerns about the company’s near-term prospects, but the long-term bull story remains intact. The technical picture suggests a potential tug-of-war between bulls and bears, with the 23.60% Fibonacci level acting as a critical pivot point. A sustained bounce above this level could see AMD resume its upward climb towards the all-time high, while a break below could trigger a deeper correction, with the 38.20% and 50.00% Fibonacci retracement acting as significant levels of interest.
Sources: TradingView, Trading Economics, AMD, Dow Jones Newswire, Seeking Alpha, Zack’s.
Piece written by Mfanafuthi Mhlongo, Trive Financial Market Analyst
Disclaimer: Trive South Africa (Pty) Ltd (hereinafter referred to as “Trive SA”), with registration number 2005/011130/07, is an authorised Financial Services Provider in terms of the Financial Advisory and Intermediary Services Act, 37 of 2002. Trive SA is authorised and regulated by the South African Financial Sector Conduct Authority (FSCA) and holds FSP number 27231. Trive Financial Services Ltd (hereinafter referred to as “Trive MU”) holds an Investment Dealer (Full-Service Dealer, excluding Underwriting) Licence with licence number GB21026295 pursuant to section 29 of the Securities Act 2005, Rule 4 of the Securities Rules 2007, and the Financial Services Rules 2008. Trive MU is authorized and regulated by the Mauritius Financial Services Commission (FSC) and holds Global Business Licence number GB21026295 under Section 72(6) of the Financial Services Act. Trive SA and Trive MU are collectively known and referred to as “Trive Africa”.
Market and economic conditions are subject to sudden change which may have a material impact on the outcome of financial instruments and may not be suitable for all investors. Trive Africa and its employees assume no liability for any loss or damage (direct, indirect, consequential, or inconsequential) that may be suffered. Please consider the risks involved before you trade or invest. All trades on the Trive Africa platform are subject to the legal terms and conditions to which you agree to be bound. Brand Logos are owned by the respective companies and not by Trive Africa. The use of a company’s brand logo does not represent an endorsement of Trive Africa by the company, nor an endorsement of the company by Trive Africa, nor does it necessarily imply any contractual relationship. Images are for illustrative purposes only and past performance is not necessarily an indication of future performance. No services are offered to stateless persons, persons under the age of 18 years, persons and/or residents of sanctioned countries or any other jurisdiction where the distribution of leveraged instruments is prohibited, and citizens of any state or country where it may be against the law of that country to trade with a South African and/or Mauritius based company and/or where the services are not made available by Trive Africa to hold an account with us. In any case, above all, it is your responsibility to avoid contravening any legislation in the country from where you are at the time.
CFDs and other margin products are complex instruments and come with a high risk of losing money rapidly due to leverage. You should consider whether you understand how these products work and whether you can afford to take the high risk of losing your money. Professional clients can lose more than they deposit. See our full Risk Disclosure and Terms of Business for further details. Some or all of the services and products are not offered to citizens or residents of certain jurisdictions where international sanctions or local regulatory requirements restrict or prohibit them.