In 2023, Apple Inc (NASDAQ: AAPL) experienced a significant 48.18% surge in market value, buoyed by milestone revenues, notably soaring iPhone sales in the September quarter and record-breaking services revenue in Q4. Despite this, worries arose about lacklustre iPhone 15 sales in China, a key market for Apple, tempering an otherwise robust performance.
The iPhone, vital to Apple’s revenue, witnessed a shifting trend, displaying slower growth and intermittent declines over the past two years, a departure from its historic growth between 2008 and 2015. While 2021 marked a surge and 2022 showed modest growth, unit sales in 2022 dipped to 232.2 million units despite surpassing the 2015 peak.
This fluctuation aligns with Counterpoint Research’s data, indicating a drop in Apple’s premium smartphone market share to 71% in 2023 from the previous year’s 75%. Consequently, a post-New Year’s selloff pushed Apple’s market value below $3 trillion, settling at $2.9 trillion after Barclays downgraded the stock, citing concerns over weakening iPhone 15 sales and the potential impact on future projections.
Technical
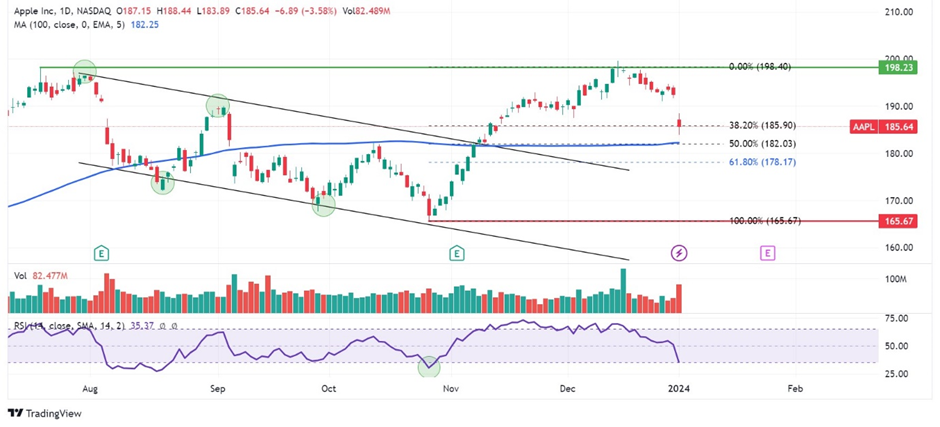
Apple’s share price underwent a notable transformation, breaking free from a descending channel pattern and the 100-day moving average, signalling a shift in trajectory. Presently, the stock maintains an upward trend above the 100-day moving average, stemming from a pivotal support level at $165.67 per share formed amid oversold RSI conditions within the descending channel.
Despite surging toward the robust resistance at $198.23 per share formed in Q3 2023, overbought RSI conditions prompted a pullback. The current focus now lies on the 50% Fibonacci Retracement level, aligned with the 100-day moving average and serving as a crucial juncture.
A breakdown beneath the 50% level on substantial volume might signal weakened confidence in the stock, potentially opening the door to the $165.67 per share support. Conversely, if the market respects the 50% level as an intermediate support, this could herald a reversal, with the potential for retesting the $198.23 per share resistance level.
Summary
Apple’s dynamic journey in 2023 showcased impressive market gains fuelled by milestone revenues, notably from the services division. Yet, concerns loomed over lacklustre iPhone 15 sales in China, impacting the tech giant’s trajectory. Technical shifts in its share price, amid resistance and support levels, reflect evolving market sentiments, with the 50% Fibonacci Retracement level serving as a pivotal point of interest.
Sources: Apple Inc, Reuters, Counterpoint Research, The Street, TradingView
Piece Written By Nkosilathi Dube, Trive Financial Market Analyst
Disclaimer: Trive South Africa (Pty) Ltd (hereinafter referred to as “Trive SA”), with registration number 2005/011130/07, is an authorised Financial Services Provider in terms of the Financial Advisory and Intermediary Services Act, 37 of 2002. Trive SA is authorised and regulated by the South African Financial Sector Conduct Authority (FSCA) and holds FSP number 27231. Trive Financial Services Ltd (hereinafter referred to as “Trive MU”) holds an Investment Dealer (Full-Service Dealer, excluding Underwriting) Licence with licence number GB21026295 pursuant to section 29 of the Securities Act 2005, Rule 4 of the Securities Rules 2007, and the Financial Services Rules 2008. Trive MU is authorized and regulated by the Mauritius Financial Services Commission (FSC) and holds Global Business Licence number GB21026295 under Section 72(6) of the Financial Services Act. Trive SA and Trive MU are collectively known and referred to as “Trive Africa”.
Market and economic conditions are subject to sudden change which may have a material impact on the outcome of financial instruments and may not be suitable for all investors. Trive Africa and its employees assume no liability for any loss or damage (direct, indirect, consequential, or inconsequential) that may be suffered. Please consider the risks involved before you trade or invest. All trades on the Trive Africa platform are subject to the legal terms and conditions to which you agree to be bound. Brand Logos are owned by the respective companies and not by Trive Africa. The use of a company’s brand logo does not represent an endorsement of Trive Africa by the company, nor an endorsement of the company by Trive Africa, nor does it necessarily imply any contractual relationship. Images are for illustrative purposes only and past performance is not necessarily an indication of future performance. No services are offered to stateless persons, persons under the age of 18 years, persons and/or residents of sanctioned countries or any other jurisdiction where the distribution of leveraged instruments is prohibited, and citizens of any state or country where it may be against the law of that country to trade with a South African and/or Mauritius based company and/or where the services are not made available by Trive Africa to hold an account with us. In any case, above all, it is your responsibility to avoid contravening any legislation in the country from where you are at the time.
CFDs and other margin products are complex instruments and come with a high risk of losing money rapidly due to leverage. You should consider whether you understand how these products work and whether you can afford to take the high risk of losing your money. Professional clients can lose more than they deposit. See our full Risk Disclosure and Terms of Business for further details. Some or all of the services and products are not offered to citizens or residents of certain jurisdictions where international sanctions or local regulatory requirements restrict or prohibit them.