
A trading strategy is an approach used in the financial markets to generate a profit. The most commonly used techniques are Scalping, Day trading, Swing Trading and Position trading. The following strategies suit different trading characters and are differentiated by the timeframe an individual trader is comfortable or available to trade with.
Traders that are inclined to engage in the market frequently use the Scalping strategy to find multiple opportunities. The strategy focuses on Lower timeframes to generate numerous trades that accumulate small profits. This approach is suitable for periods of high trading volume to capture short-term trends and is generally used in timeframes below the 1-Hour chart.
Day traders open and close positions within one trading day. The approach suits traders uncomfortable with the fast-paced scalping and unavailable throughout the day to monitor the charts consistently. Intraday charts that break down the day into minutes or hours are used in this approach. Charts used include the 30-Minute, 1-Hour or 4-Hour chart.
Swing trading is a longer-term approach to trading markets where positions are held for more than one day. This approach is suitable for traders with limited time to monitor the markets frequently. It involves identifying potential trends that can produce large swings in price. This approach typically uses both technical analysis and fundamental analysis (economic health) to determine the beginning of a price trend.
Position trading is the approach with the most extended time horizon. Traders that use this approach typically hold positions for months to years and mostly use fundamental analysis to generate trade ideas.
Basic Strategies
Support and Resistance
Support and resistance are one of the most commonly used concepts in trading. It refers to levels on the chart where the price moves away from, either upward or downward. These levels are more likely to act as levels in which price cannot move beyond, similar to a barrier or a stopping force. Support and Resistance form due to supply and demand dynamics at specific price points. Resistance levels form when supply outweighs demand, which pushes the price down, while support levels form when demand outweighs collection, thereby pushing the price up.
Support is the lowest level of this barrier, while resistance is the highest level of the barrier. The trading strategy that can be used subsequently embodies one of the oldest yet most relevant rules in the finance industry: to Buy Low and Sell High. With this strategy in use, buying occurs at the lowest price level, support, while selling happens at the highest price level, resistance.
To find Support and Resistance levels, one has to observe the charts and find a level where the price frequently touches and reacts at least twice. Once identified, a line is drawn from one point to the other, either horizontally (when the price is trading within a range) or diagonally (when the price is moving in a trend, either up or down), as shown below.
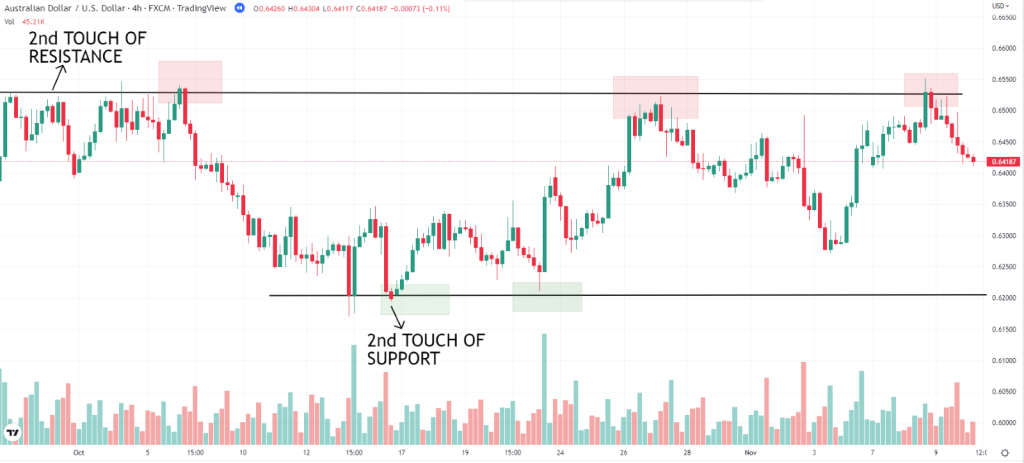
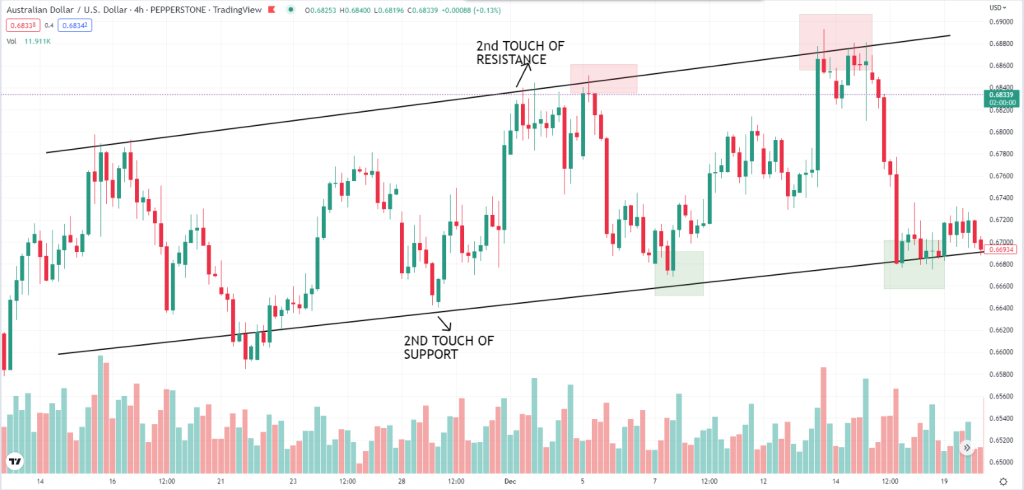
The more frequently the price touches the level and reverses, the greater the validity of the price level (i.e. if the support or resistance level is respected more than once, it is more likely to be respected in the future and therefore, trades can be taken from these levels with a higher sense of confidence).
This strategy is very effective as it uses past price data to identify critical areas on a chart to buy and sell while being a straightforward and easy-to-use strategy.
Moving Averages and Moving Average Crossover
The moving average is a technical indicator provided by most trading platforms. It is a direct reflection of price action, smoothed out by averaging updated prices over a selected time period. It is shown on the chart as a single line or multiple lines, depending on how many moving averages are used for the strategy. A moving average can be used for short-term, medium-term and long-term technical analysis and primarily to identify trends. It works well as part of a trend trading strategy, given that the market is not moving sideways.
Typical moving average lengths include the 10, 20, 50, 100 and 200 moving averages. The longer the length, the more price data points are included in calculating the moving average and, therefore, the slower it responds to recent and current changes. Lower-length moving averages are more responsive to changes in price as they incorporate fewer data points.
Upward Sloping and Downward Sloping Moving Average
An Upward sloping moving average represents an uptrend in price action, while a downward-sloping moving average represents a downtrend in price. The trend is further confirmed by analysing candlesticks in relation to the moving average’s location. An uptrend and downtrend are depicted by candlesticks being above or below the moving average line, respectively, as the price will be trading either above or below its average.
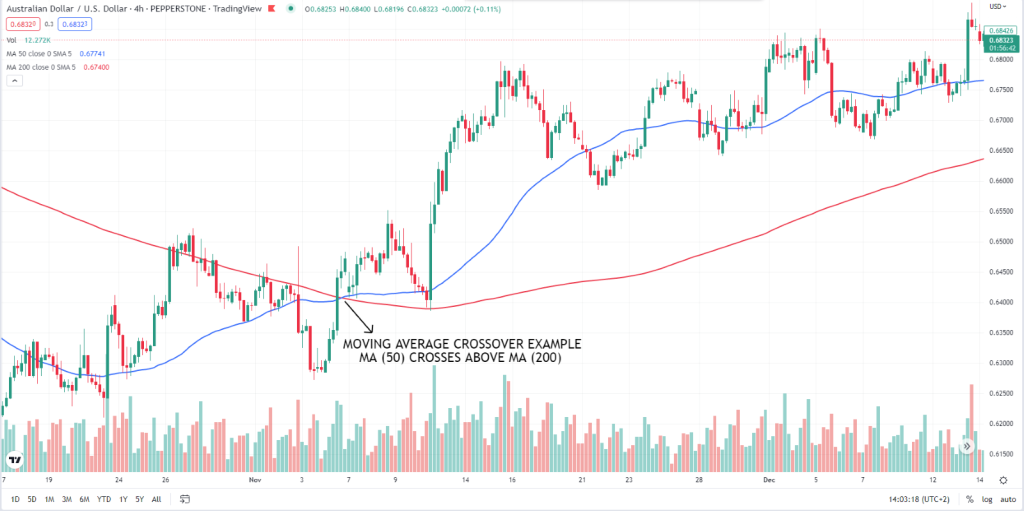
One of the most commonly used strategies using moving averages is to combine two or more moving averages of different lengths. For example, a short and responsive moving average (50) can be combined with a longer and less responsive moving average (200). When the shorter-term moving average (Blue) crosses above the longer-term moving average (Red), it represents short-term bullishness in the market. It may result in price moving upwards, referred to as the golden cross. On the other hand, when the shorter-term moving average (Blue) crosses below the longer-term moving average (Red), it represents short-term bearishness in the market. It could result in the price moving downward, referred to as the death cross. Likewise, when using one moving average, price crossing above or below could signal upward, or downward movement as the trend takes shape.
Golden Cross
Death Cross
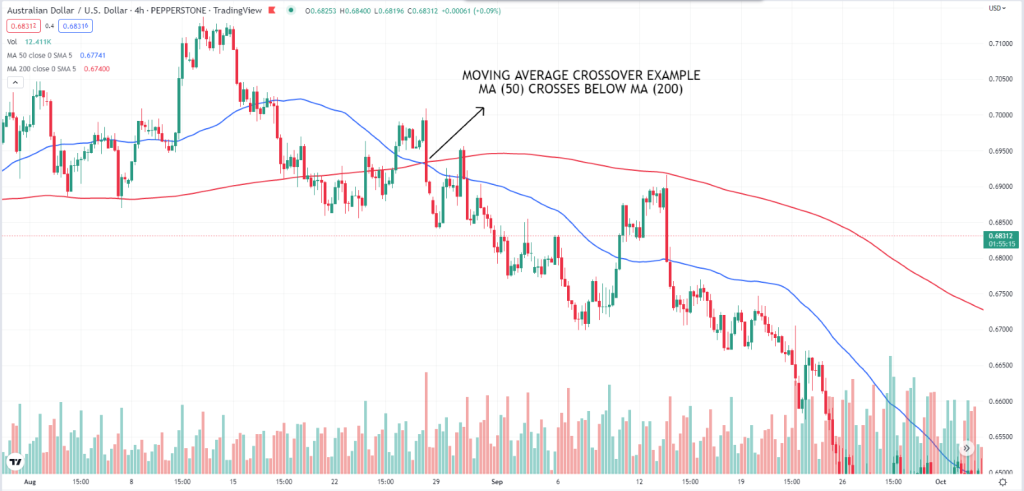
Moving averages: 50 (Blue) | 200 (Red)
Breakout
The breakout trading strategy is a trend-following strategy that uses swing points to identify where and when to trade. In an uptrend, the market produces swing points with Higher Highs and Higher Lows, while a downtrend produces Lower Highs and Lower Lows.
This strategy involves taking a trade at the breakout of the prior swing point in anticipation of a continued move, either up or down. The strategy should, however, be used with caution as not every breakout will lead to a sustained move in the direction of the breakout. In some cases, the price may break above or below the prior swing point and retrace back towards its origin, a strategy we will explore after the breakout strategy.
However, should there be strong momentum in the move after a breakout, the strategy can produce decent profits, as shown in the graphs below. Volume, a technical indicator that measures market activity at certain price levels, can be used to identify the market’s momentum at the breakout time. Ideally, when a breakout occurs on high volume or incremental volume before the breakout, it signals significant participation in the market at the price level and, subsequently, the potential for high momentum and a strong price movement in the direction of the breakout.
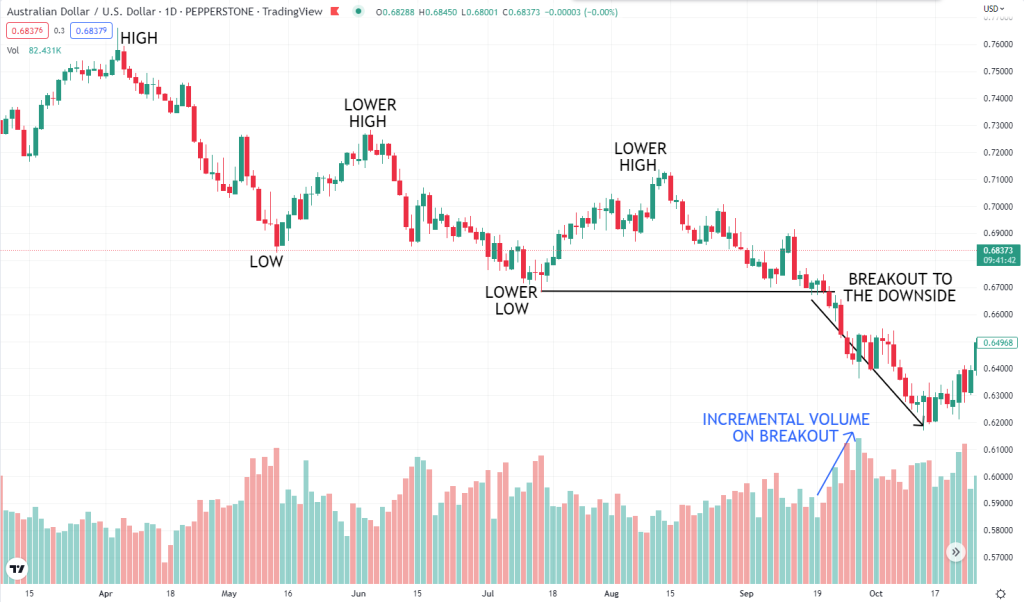
In the above example, the price was in a downtrend leaving behind Lower Highs and Lower Lows. Price broke out below the prior swing low, represented by the horizontal line. The price broke out to the downside with high momentum represented by the incremental volume before and after the breakout. A sustained move downwards was the result. To identify whether the price will sustain the direction of the breakout, momentum indicators such as the Moving Average Convergence Divergence (MACD) indicator can be used for confirmation, among others.
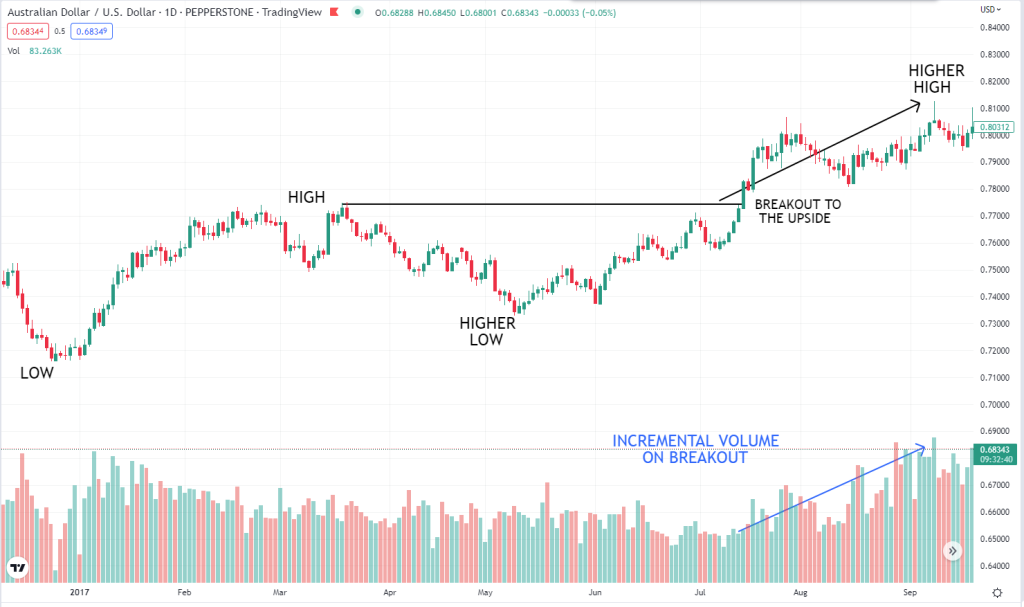
The above example shows a breakout occurs in an uptrend, with Higher Highs and Higher lows printed. Similar to the first example, a breakout occurs with high momentum defined by incremental volume, which pushes the price further upwards. A long position taken on the breakout would bear decent profits in this setup.
Retracement
The final basic strategy is the retracement strategy which builds on the foundation of the breakout strategy. Since the price zigzags up and down, the expectation is that the price will return to the breakout point or further when a breakout occurs.
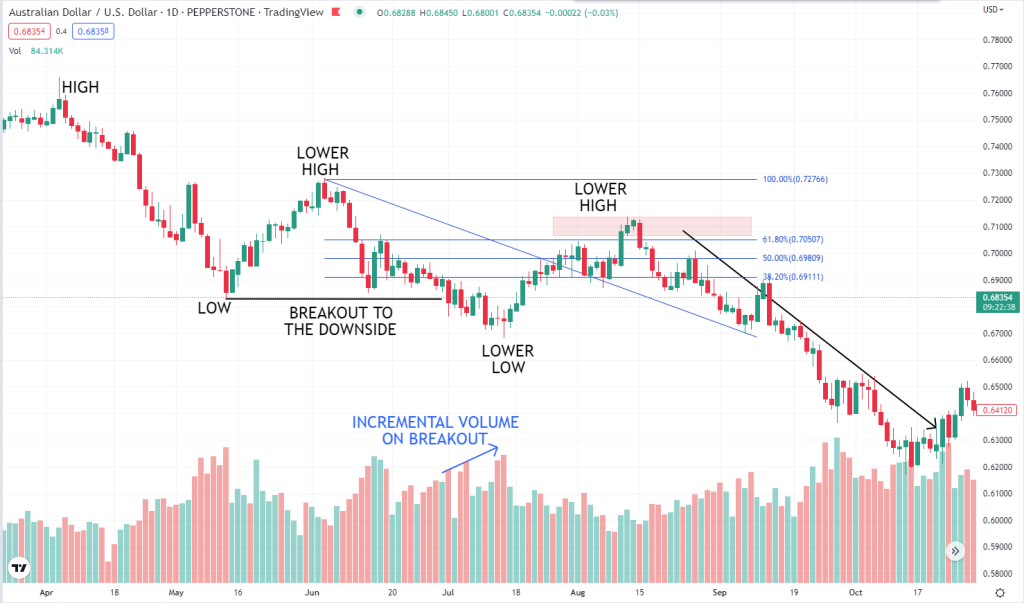
In this case, the trader can apply various tools to identify where to buy or sell in the retracement. One of this strategy’s most commonly used tools is the Fibonacci retracement. The Fibonacci retracement is a set of horizontal trendlines that reflect potential support or resistance zones drawn between two swing points. These points represent possible reversal levels within the retracement. The most essential and effective zone is the 61.8% retracement zone, considered the golden ratio. The Fibonacci series and golden ratio are derived from a sequence of numbers where each entry is a sum of the preceding two. When each figure is divided by the previous figure in the sequence, it consistently produces a result of 61.8%, which is the golden ratio. In many instances, the price will reverse to these levels and bounce off them as many traders and institutional algorithms monitor them. Below is a continuation of the breakout examples with a Fibonacci retracement drawn between the two swing points.
Downtrend
Uptrend
The price breaks out to the downside and upside in both examples above. When the price begins to reverse, a Fibonacci retracement is drawn between the two swing points, as shown above. The retracement continues to just below the golden ratio or the 61% zone and reverses to begin another wave of bearish and bullish movement, respectively. Ideally, for this strategy to be effective, a trader should wait for the price to retrace to either 61% or 50% zones before taking a trade in the direction of the predominant trend.
Conclusion
The strategies explored in this piece are few among many. Depending on the trader’s availability, expectations and capital, different approaches will suit different traders.
REFERENCES:
https://www.babypips.com/learn/forex/time-frame-combinations
https://www.babypips.com/learn/forex/day-trading
https://www.investopedia.com/articles/trading/05/011705.asp
https://www.babypips.com/learn/forex/swing-trading
https://www.investopedia.com/trading/introduction-to-swing-trading/
https://www.babypips.com/learn/forex/position-trader
Disclaimer: Trive South Africa (Pty) Ltd (hereinafter referred to as “Trive SA”), with registration number 2005/011130/07, is an authorised Financial Services Provider in terms of the Financial Advisory and Intermediary Services Act, 37 of 2002. Trive SA is authorised and regulated by the South African Financial Sector Conduct Authority (FSCA) and holds FSP number 27231. Trive Financial Services Ltd (hereinafter referred to as “Trive MU”) holds an Investment Dealer (Full-Service Dealer, excluding Underwriting) Licence with licence number GB21026295 pursuant to section 29 of the Securities Act 2005, Rule 4 of the Securities Rules 2007, and the Financial Services Rules 2008. Trive MU is authorized and regulated by the Mauritius Financial Services Commission (FSC) and holds Global Business Licence number GB21026295 under Section 72(6) of the Financial Services Act. Trive SA and Trive MU are collectively known and referred to as “Trive Africa”.
Market and economic conditions are subject to sudden change which may have a material impact on the outcome of financial instruments and may not be suitable for all investors. Trive Africa and its employees assume no liability for any loss or damage (direct, indirect, consequential, or inconsequential) that may be suffered. Please consider the risks involved before you trade or invest. All trades on the Trive Africa platform are subject to the legal terms and conditions to which you agree to be bound. Brand Logos are owned by the respective companies and not by Trive Africa. The use of a company’s brand logo does not represent an endorsement of Trive Africa by the company, nor an endorsement of the company by Trive Africa, nor does it necessarily imply any contractual relationship. Images are for illustrative purposes only and past performance is not necessarily an indication of future performance. No services are offered to stateless persons, persons under the age of 18 years, persons and/or residents of sanctioned countries or any other jurisdiction where the distribution of leveraged instruments is prohibited, and citizens of any state or country where it may be against the law of that country to trade with a South African and/or Mauritius based company and/or where the services are not made available by Trive Africa to hold an account with us. In any case, above all, it is your responsibility to avoid contravening any legislation in the country from where you are at the time.
CFDs and other margin products are complex instruments and come with a high risk of losing money rapidly due to leverage. You should consider whether you understand how these products work and whether you can afford to take the high risk of losing your money. Professional clients can lose more than they deposit. See our full Risk Disclosure and Terms of Business for further details. Some or all of the services and products are not offered to citizens or residents of certain jurisdictions where international sanctions or local regulatory requirements restrict or prohibit them.