
The US Dollar Index (DXY) finds itself in a pivotal position as market participants gauge the strength of the US economy following the recent hot inflation data and expectations for future Federal Reserve interest rate cuts. The hotter-than-expected February inflation report, with headline figures at 3.2% year-on-year, has cast doubt on the Fed’s ability to deliver the previously anticipated multiple rate cuts in 2024. Markets have trimmed their bets on a June rate cut, with chances now hovering around 67% compared to 71% earlier in the week.
However, the dollar has yet to react decisively to this shift. Investors are awaiting further data releases, such as US retail sales and producer prices, before solidifying their positions. Additionally, the Bank of Japan’s (BoJ) upcoming policy decision is being closely watched as speculation swirls around potential adjustments to their negative interest rate policy. This could significantly impact the Yen and, by extension, the broader USD basket.
Technical Analysis
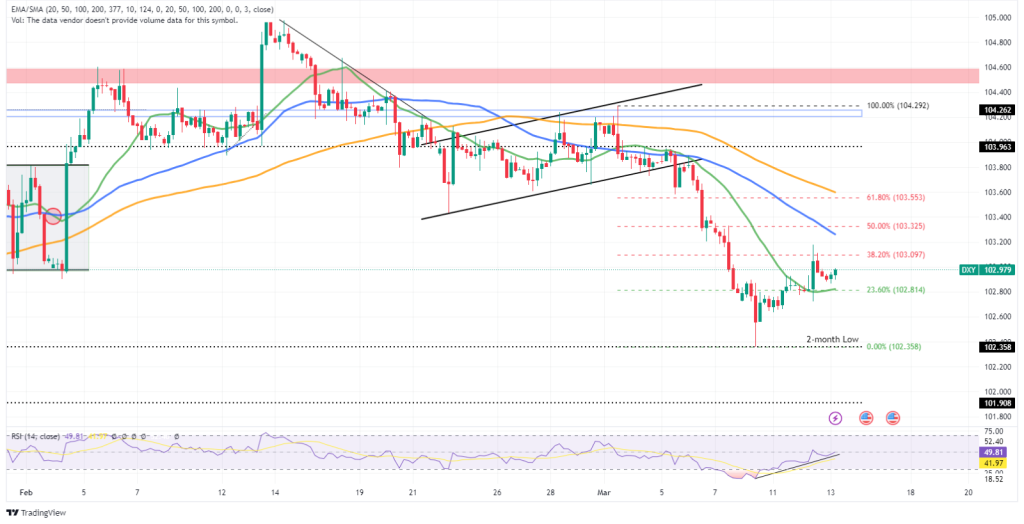
The 4-hour chart shows that the DXY is currently trading at 102.979, attempting to extend its three-day climb. The price action recently broke above the 20-period Simple Moving Average (SMA) (green line) but remains below the 50-period SMA (blue line) and the 100-period SMA (orange line). This indicates a potential short-term uptrend lacking confirmation from longer-term indicators.
The key resistance level to watch is the 38.20% Fibonacci retracement level at 103.325. A successful break above this level could open doors for short-term trading opportunities towards the 50.00% Fibonacci retracement level (103.553).
However, with the RSI (49.81) trading below the 50.00 level, failure to sustain a break above the 20-SMA would leave the two-month low of 102.358 as the potential immediate support level lower. A break below the initial support on significant volume would likely bring the 101.908 support level into play in the short term.
Summary
The US Dollar’s near-term direction hinges on the interplay between incoming economic data and the Fed’s monetary policy stance. Technically, DXY faces resistance at the 38.20% Fibonacci retracement level, with a break above potentially triggering further upside. Conversely, a drop below the 20-period SMA could lead to a retest of recent lows. The upcoming USUS reports, including the retail sales, will be key data points to watch, potentially influencing the dollar’s trajectory in the coming days.
Sources: TradingView, Trading Economics, USUS Bureau of Labor Statistics, Reuters.
Piece written by Mfanafuthi Mhlongo, Trive Financial Market Analyst
Disclaimer: Trive South Africa (Pty) Ltd (hereinafter referred to as “Trive SA”), with registration number 2005/011130/07, is an authorised Financial Services Provider in terms of the Financial Advisory and Intermediary Services Act, 37 of 2002. Trive SA is authorised and regulated by the South African Financial Sector Conduct Authority (FSCA) and holds FSP number 27231. Trive Financial Services Ltd (hereinafter referred to as “Trive MU”) holds an Investment Dealer (Full-Service Dealer, excluding Underwriting) Licence with licence number GB21026295 pursuant to section 29 of the Securities Act 2005, Rule 4 of the Securities Rules 2007, and the Financial Services Rules 2008. Trive MU is authorized and regulated by the Mauritius Financial Services Commission (FSC) and holds Global Business Licence number GB21026295 under Section 72(6) of the Financial Services Act. Trive SA and Trive MU are collectively known and referred to as “Trive Africa”.
Market and economic conditions are subject to sudden change which may have a material impact on the outcome of financial instruments and may not be suitable for all investors. Trive Africa and its employees assume no liability for any loss or damage (direct, indirect, consequential, or inconsequential) that may be suffered. Please consider the risks involved before you trade or invest. All trades on the Trive Africa platform are subject to the legal terms and conditions to which you agree to be bound. Brand Logos are owned by the respective companies and not by Trive Africa. The use of a company’s brand logo does not represent an endorsement of Trive Africa by the company, nor an endorsement of the company by Trive Africa, nor does it necessarily imply any contractual relationship. Images are for illustrative purposes only and past performance is not necessarily an indication of future performance. No services are offered to stateless persons, persons under the age of 18 years, persons and/or residents of sanctioned countries or any other jurisdiction where the distribution of leveraged instruments is prohibited, and citizens of any state or country where it may be against the law of that country to trade with a South African and/or Mauritius based company and/or where the services are not made available by Trive Africa to hold an account with us. In any case, above all, it is your responsibility to avoid contravening any legislation in the country from where you are at the time.
CFDs and other margin products are complex instruments and come with a high risk of losing money rapidly due to leverage. You should consider whether you understand how these products work and whether you can afford to take the high risk of losing your money. Professional clients can lose more than they deposit. See our full Risk Disclosure and Terms of Business for further details. Some or all of the services and products are not offered to citizens or residents of certain jurisdictions where international sanctions or local regulatory requirements restrict or prohibit them.