The S&P500 Futures (CME: ES) have surged in the current week, notably driven by a robust performance in the tech sector.
Trading 1.08% higher, the index futures appear set for a third consecutive positive week, buoyed by renewed confidence in tech stocks. This resurgence follows impressive results from the world’s largest chip maker, Taiwan Semiconductor Manufacturing Co (TSM).
Adding to the positive momentum is recent data indicating robust U.S. economic growth in the fourth quarter, with GDP expanding by a surprising 3.3%, exceeding forecasts of 2%. Notably, a significant 82% of S&P 500 companies reporting earnings have surpassed expectations, as per data from the London Stock Exchange Group, supporting the upside momentum. Furthermore, the flat reading of the PCE Price index at 2.6% offers an encouraging signal of inflation containment, potentially setting the stage for future rate cuts.
Technical
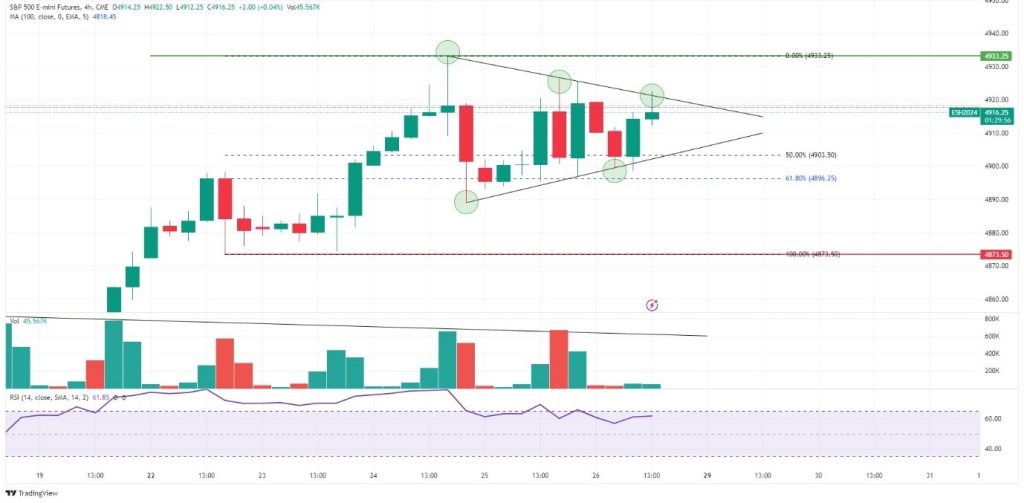
The S&P500 Futures exhibit a consolidation phase, encapsulated within the confines of a symmetrical triangle, setting the stage for potential volatility following the PCE Price Index report.
A momentary pause in the futures’ rally led to a dip, finding solid support at the 4873.50 level. The subsequent resurgence marked a peak, reaching an all-time high, only to be met with a retreat, leaving a notable resistance level at 4933.25 amid overbought RSI conditions.
The 61.80% Fibonacci Retracement Golden Ratio acted as a resilient intermediate support, thwarting sustained bearish pressures. The impending high volume breakout from the symmetrical triangle could herald an extended move, with the 4933.25 level becoming a potential focal point to the upside if a breakout materializes. Conversely, a retest of the 61.80% Golden Ratio looms if bearish pressures intensify, leading to a breakdown beneath the pattern.
Summary
The S&P500 Futures, propelled by strong tech sector performance, trade 1.08% higher and are poised for a third positive week. Robust economic data, led by a surprise 3.3% GDP growth, reinforces the uptrend, while positive earnings reports amplify optimism. The PCE Price index at 2.6% hints at inflation containment, possibly paving the way for future rate cuts. Technically, within a symmetrical triangle, the index faces a potential breakout, with the 4933.25 resistance as an upside focal point, contingent on sustained bullish momentum. Conversely, if bearish pressures escalate, a retest of the 61.80% Golden Ratio may occur.
Sources: U.S. Bureau of Economic Analysis, Wall Street Journal, London Stock Exchange Group, Reuters, TradingView
Piece Written By Nkosilathi Dube, Trive Financial Market Analyst
Disclaimer: Trive South Africa (Pty) Ltd (hereinafter referred to as “Trive SA”), with registration number 2005/011130/07, is an authorised Financial Services Provider in terms of the Financial Advisory and Intermediary Services Act, 37 of 2002. Trive SA is authorised and regulated by the South African Financial Sector Conduct Authority (FSCA) and holds FSP number 27231. Trive Financial Services Ltd (hereinafter referred to as “Trive MU”) holds an Investment Dealer (Full-Service Dealer, excluding Underwriting) Licence with licence number GB21026295 pursuant to section 29 of the Securities Act 2005, Rule 4 of the Securities Rules 2007, and the Financial Services Rules 2008. Trive MU is authorized and regulated by the Mauritius Financial Services Commission (FSC) and holds Global Business Licence number GB21026295 under Section 72(6) of the Financial Services Act. Trive SA and Trive MU are collectively known and referred to as “Trive Africa”.
Market and economic conditions are subject to sudden change which may have a material impact on the outcome of financial instruments and may not be suitable for all investors. Trive Africa and its employees assume no liability for any loss or damage (direct, indirect, consequential, or inconsequential) that may be suffered. Please consider the risks involved before you trade or invest. All trades on the Trive Africa platform are subject to the legal terms and conditions to which you agree to be bound. Brand Logos are owned by the respective companies and not by Trive Africa. The use of a company’s brand logo does not represent an endorsement of Trive Africa by the company, nor an endorsement of the company by Trive Africa, nor does it necessarily imply any contractual relationship. Images are for illustrative purposes only and past performance is not necessarily an indication of future performance. No services are offered to stateless persons, persons under the age of 18 years, persons and/or residents of sanctioned countries or any other jurisdiction where the distribution of leveraged instruments is prohibited, and citizens of any state or country where it may be against the law of that country to trade with a South African and/or Mauritius based company and/or where the services are not made available by Trive Africa to hold an account with us. In any case, above all, it is your responsibility to avoid contravening any legislation in the country from where you are at the time.
CFDs and other margin products are complex instruments and come with a high risk of losing money rapidly due to leverage. You should consider whether you understand how these products work and whether you can afford to take the high risk of losing your money. Professional clients can lose more than they deposit. See our full Risk Disclosure and Terms of Business for further details. Some or all of the services and products are not offered to citizens or residents of certain jurisdictions where international sanctions or local regulatory requirements restrict or prohibit them.