Amidst escalating tensions in the Middle East, the energy sector is once again riding the waves of oil supply concerns. ConocoPhillips (NYSE: COP), a prominent player in this field, faced its share of challenges when it disclosed a less-than-stellar earnings report last August. This setback was primarily attributed to the dip in oil and gas prices during the quarter, resulting in a notable drop in their adjusted earnings per share (EPS) from $3.90 to a modest $1.84. Total revenue and other income also saw a decline, slipping from $21.99 billion in the year-ago quarter to $12.88 billion.
Despite these obstacles, there’s a glimmer of hope on the horizon. ConocoPhillips managed to boost its output by an impressive 6%, reaching 1.81 million barrels of oil equivalent per day (boepd). In light of this production increase, they have revised their 2023 fiscal year production guidance from 1.78 million – 1.80 million boepd to 1.80 million – 1.81 million boepd. This strategic move positions them favourably to capitalize on the rebounding oil prices.
Furthermore, the recent acquisition of the remaining interest in the Surmont oil sands project, Canada’s fourth-largest oil-sand well site, presents a promising opportunity to enhance production as they optimize these assets in the days ahead. ConocoPhillips is navigating the complexities of the energy sector with resilience and adaptability, setting its sights on a bright future amid ever-evolving global dynamics.
Technical
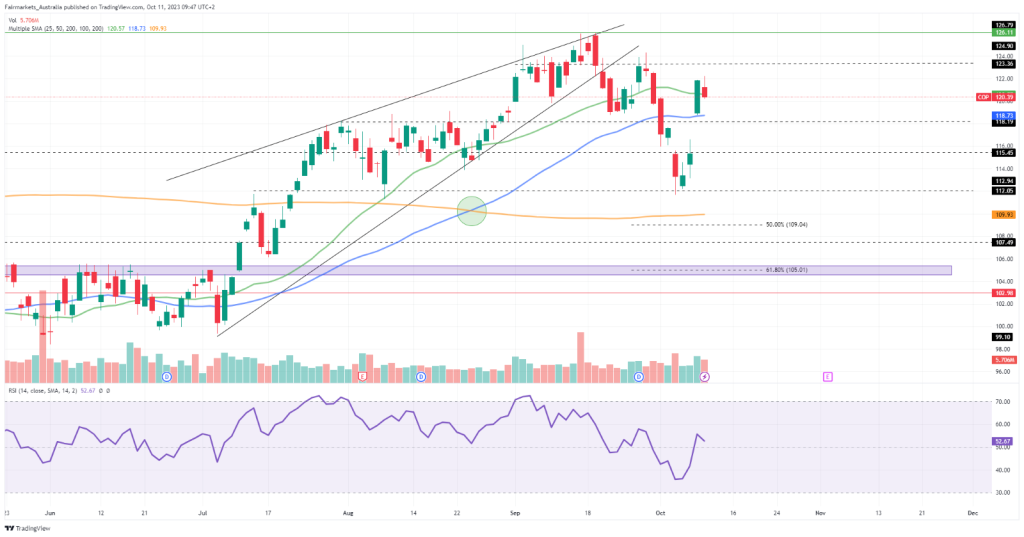
On the 1D chart, a rising wedge pattern experienced a breakdown, leading to a significant downturn, ultimately finding support at $112.05. However, the week started on the front foot, tracking the rise in oil prices, resulting in a 5.63% expansion on Monday. With the 50-SMA (blue line) forming a golden cross by crossing the 200-SMA (orange line) to the upside, the medium-term momentum tilts in the bullish favour as the price nears a retest of the breakdown point at $123.36.
With the FOMC meeting minutes and inflation data from the US due later this week, the potential movements in the oil price could filter through to the share price. If resistance at $123.36 limits the upside, a reversal of the current uptick could bring support at $118.19 back into focus close to the 50-SMA. Movement below this support could confirm the downtrend, potentially shifting the price toward the Fibonacci midpoint and golden ratio at $109.04 and $105.01, respectively, in the longer term.
However, continued strength in the oil price could trigger a breakout at $123.36, shifting the price above the wedge breakdown level. In this case, the share price could look to test the resistance at $126.11 in the upcoming sessions.
Summary
Despite a disappointing earnings report in August, ConocoPhillips has been on a resilient path to recovery, riding the wave of the recent oil price rise. As we advance, the $123.36 resistance could be a key level of interest, where the breakdown level could undergo a retest, either resulting in another leg up toward $126.11 or a subsequent reversal back to $118.19.
Sources: Koyfin, Tradingview, ConocoPhillips
Piece written by Taan van Aswegen, Trive Financial Market Analyst
Disclaimer: Trive South Africa (Pty) Ltd, Registration number 2005/011130/07, and an Authorised Financial Services Provider in terms of the Financial Advisory and Intermediary Services Act 2002 (FSP No. 27231). Any analysis/data/opinion contained herein are for informational purposes only and should not be considered advice or a recommendation to invest in any security. The content herein was created using proprietary strategies based on parameters that may include price, time, economic events, liquidity, risk, and macro and cyclical analysis. Securities involve a degree of risk and are volatile instruments. Market and economic conditions are subject to sudden change, which may have a material impact on the outcome of financial instruments and may not be suitable for all investors. When trading or investing in securities or alternative products, the value of the product can increase or decrease meaning your investment can increase or decrease in value. Past performance is not an indication of future performance. Trive South Africa (Pty) Ltd, and its employees assume no liability for any loss or damage (direct, indirect, consequential, or inconsequential) that may be suffered from using or relying on the information contained herein. Please consider the risks involved before you trade or invest.