
Despite dovish developments in the US economy, the EURUSD faced a challenging week last week, fuelled by declining inflation in the Eurozone, which triggered a selloff on Thursday. Year-over-year inflation declined from 2.9% to 2.4%, falling below the 2.7% forecast, while the core inflation showed a similar decline from 4.2% to 3.6%, defying the consensus for a 3.9% print.
However, Friday provided some respite as Jerome Powell confirmed the sentiment that rate cuts might happen in a few months, acknowledging that the current monetary policy is working as expected in slowing the economy down. The CME FedWatch Tool attributes a 54% chance of a cut in March, with a 38% probability of another cut in May. In the upcoming week, the two falling currencies will be fully engaged in a tug of war, awaiting the pivotal NFP print on Friday to confirm a sustainable trend direction.
Technical
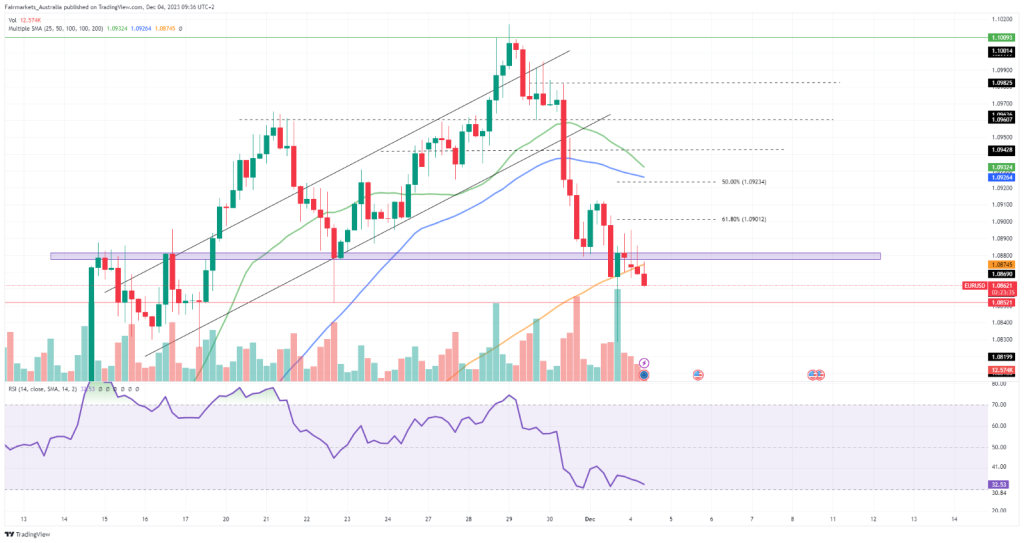
On the 4H chart, a bearish trend has prevailed following a breakdown of the ascending channel pattern. The currency pair has fallen below the 25-SMA (green line), 50-SMA (blue line), and recently the 100-SMA (orange line), which now offers resistance to the potential recovery. However, the RSI indicates potential oversold conditions, which could result in a temporary pullback.
If the currency pair can push above the 100-SMA at 1.0875, a prior demand zone close to 1.0882 could be the first hurdle to the retracement. However, a push above the demand zone could see a retest of the 61.8% Fibonacci golden ratio at 1.0901 before the prior Fibonacci midpoint comes into play, offering additional resistance close to the 50-SMA at 1.0923.
The downtrend could extend into the new week if the currency pair fails to withstand the 100-SMA resistance. Neckline support is established at 1.0852, which could offer a last line of defence. If this support fails to withhold the selling pressure, a longer-term downtrend could trickle toward 1.0832 in the upcoming sessions.
Summary
The EURUSD currency pair has been under heavy selling pressure in recent sessions and is fast approaching the neckline support at 1.0852. This support could be crucial in either catalysing a pullback above the 100-SMA or confirming the presence of sustainable selling pressure, which could extend the downtrend toward 1.0832.
Sources: Koyfin, Tradingview, Reuters
Piece written by Tiaan van Aswegen, Trive Financial Market Analyst
Disclaimer: Trive South Africa (Pty) Ltd, Registration number 2005/011130/07, and an Authorised Financial Services Provider in terms of the Financial Advisory and Intermediary Services Act 2002 (FSP No. 27231). Any analysis/data/opinion contained herein are for informational purposes only and should not be considered advice or a recommendation to invest in any security. The content herein was created using proprietary strategies based on parameters that may include price, time, economic events, liquidity, risk, and macro and cyclical analysis. Securities involve a degree of risk and are volatile instruments. Market and economic conditions are subject to sudden change, which may have a material impact on the outcome of financial instruments and may not be suitable for all investors. When trading or investing in securities or alternative products, the value of the product can increase or decrease meaning your investment can increase or decrease in value. Past performance is not an indication of future performance. Trive South Africa (Pty) Ltd, and its employees assume no liability for any loss or damage (direct, indirect, consequential, or inconsequential) that may be suffered from using or relying on the information contained herein. Please consider the risks involved before you trade or invest.