
Take-Two Interactive Software, Inc. (NASDAQ: TTWO) has witnessed notable volatility, marked by a surge following its inclusion in the Nasdaq 100 index on December 18, showcasing the potential benefits of increased visibility and investor interest. This addition, replacing Seagen due to Pfizer’s acquisition, boosted TTWO’s shares by around 4% premarket. Despite a recent dip, TTWO boasts a strong year-to-date performance, up by 52.19%.
However, fundamental analysis reveals a potential challenge in the upcoming quarterly earnings, with anticipated earnings per share (EPS) at $0.87, reflecting a year-over-year decline of -6.5%. There’s also a downward trend in EPS estimates over the past month, raising caution among investors.
Technical Analysis:
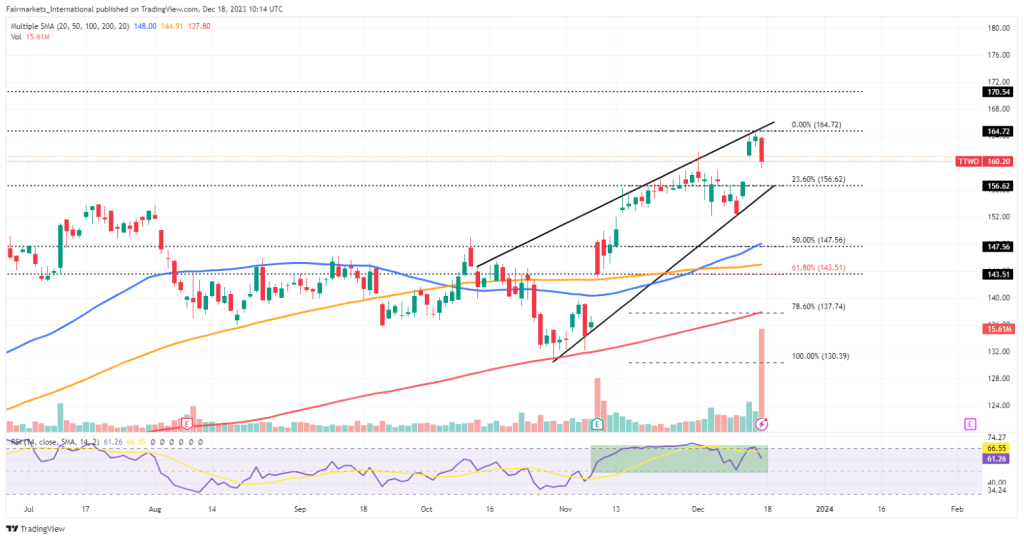
TTWO’s current price at $160.20 demonstrates a bearish trend within a rising wedge trading pattern. Despite trading above the 50-SMA (blue line), 100-SMA (orange line), and 200-SMA (red line), the RSI’s sharp decline to 61.26 suggests a potential reversal.
For short-term trading opportunities, a push lower could target the $156.62 support level. A break below the initial support and the wedge could trigger a run lower and would likely bring the $147.56 and $143.41 support levels into play.
However, short-term trading opportunities towards the $164.72 resistance level could arise should the price action fail to sustain a push lower. A break above the initial resistance could confirm the bullish momentum, likely bringing the $170.54 resistance level within the bulls’ reach in the short term.
Summary:
TTWO’s inclusion in the Nasdaq 100 index has spurred short-term gains, but caution prevails due to a decline in projected earnings and downward EPS estimate revisions. The current technical setup indicates a potential bearish reversal within the rising wedge pattern. Key levels to watch include $156.62 and $164.72, which could steer short-term trading sentiment.
Monitoring TTWO’s performance amidst these technical patterns and fundamental indicators will be crucial for traders seeking opportunities, with the $143.41 support level and $170.54 resistance level serving as significant thresholds in determining the stock’s future trajectory.
Sources: TradingView, Trading Economics, Reuters, Take-Two Interactive, Dow Jones Newswire, Datatec, IOL, MT Newswire.
Piece written by Mfanafuthi Mhlongo, Trive Financial Market Analyst
Disclaimer: Trive South Africa (Pty) Ltd, Registration number 2005/011130/07, and an Authorised Financial Services Provider in terms of the Financial Advisory and Intermediary Services Act 2002 (FSP No. 27231). Any analysis/data/opinion contained herein are for informational purposes only and should not be considered advice or a recommendation to invest in any security. The content herein was created using proprietary strategies based on parameters that may include price, time, economic events, liquidity, risk, and macro and cyclical analysis. Securities involve a degree of risk and are volatile instruments. Market and economic conditions are subject to sudden change, which may have a material impact on the outcome of financial instruments and may not be suitable for all investors. When trading or investing in securities or alternative products, the value of the product can increase or decrease meaning your investment can increase or decrease in value. Past performance is not an indication of future performance. Trive South Africa (Pty) Ltd, and its employees assume no liability for any loss or damage (direct, indirect, consequential, or inconsequential) that may be suffered from using or relying on the information contained herein. Please consider the risks involved before you trade or invest.