The GBPCAD currency pair recently exhibited signs of fatigue at the peak of its impressive upward trend. This retracement was notably underscored by the Bank of Canada’s decision on Wednesday to maintain its interest rates at 5%, accompanied by a subtle hint of the possibility of a future rate hike in response to ongoing inflation concerns.
However, the Canadian dollar swiftly surrendered its gains as market participants acknowledged the looming risks of an economic slowdown. The prevailing sentiment also found support in the broader trend of declining prices, prompting speculation that the Bank of Canada may adopt a less hawkish stance in the coming months. Furthermore, the Canadian dollar faced headwinds as oil, a key Canadian export, experienced a significant drop due to unexpectedly high gasoline inventory levels, further underpinning the potential correction of the current pullback.
Technical
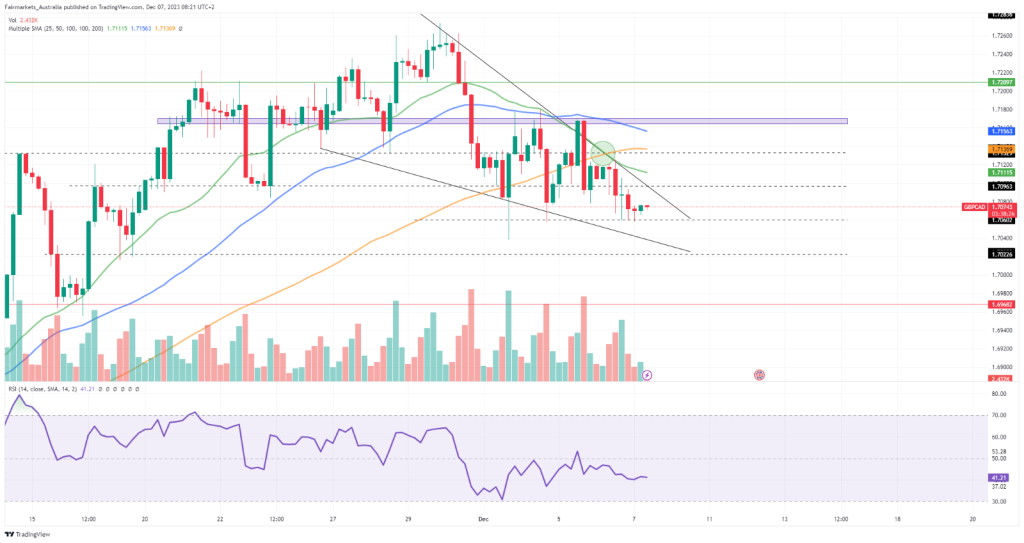
On the 4H chart, a falling wedge has emerged, which leaves the possibility of a potential bullish breakout. However, the 100-SMA (orange line) recently cut above the 25-SMA (green line), suggesting a shift in the shorter-term momentum to the downside.
Support at 1.7060 is currently providing support to the currency pair, with the dynamic resistance of the wedge offering the next hurdle to the upside at 1.7096. A breakout above this level could trigger a bullish rally toward the 25-SMA at 1.7112 and 1.7137, where the 100-SMA further offers resistance. Clearance of these levels could result in a retest of the supply zone close to the 50-SMA of 1.7156.
However, failure to clear to 1.7096 resistance could be detrimental to the buyers’ hopes, as the currency pair could retreat back toward 1.7060 to remain within the wedge formation. Lower support at 1.7023 could then be the last level of defence against a sustainable downturn, which may meet support at 1.6968.
Summary
After the Canadian dollar gave back some of its gains on Wednesday, the GBPCAD currency pair trades within a narrow wedge, with resistance at 1.7096 being critical in determining whether the breakout from the falling wedge would play out.
Sources: Koyfin, Tradingview
Piece written by Tiaan van Aswegen, Trive Financial Market Analyst
Disclaimer: Trive South Africa (Pty) Ltd, Registration number 2005/011130/07, and an Authorised Financial Services Provider in terms of the Financial Advisory and Intermediary Services Act 2002 (FSP No. 27231). Any analysis/data/opinion contained herein are for informational purposes only and should not be considered advice or a recommendation to invest in any security. The content herein was created using proprietary strategies based on parameters that may include price, time, economic events, liquidity, risk, and macro and cyclical analysis. Securities involve a degree of risk and are volatile instruments. Market and economic conditions are subject to sudden change, which may have a material impact on the outcome of financial instruments and may not be suitable for all investors. When trading or investing in securities or alternative products, the value of the product can increase or decrease meaning your investment can increase or decrease in value. Past performance is not an indication of future performance. Trive South Africa (Pty) Ltd, and its employees assume no liability for any loss or damage (direct, indirect, consequential, or inconsequential) that may be suffered from using or relying on the information contained herein. Please consider the risks involved before you trade or invest.