
The current trajectory of the gold spot price (XAUUSD) exhibits a period of consolidation after a recent upward surge, maintaining its position above the significant $2,000 per ounce threshold. Anticipation of forthcoming interest rate cuts in the early months of the upcoming year has exerted influence on the dollar, notwithstanding remarks from Federal Reserve officials that have tempered the perceived aggressiveness of market expectations regarding rate cuts.
Nonetheless, the CME FedWatch Tool points to an 81% likelihood of lower rates following next year’s March meeting, painting a favourable picture for the spot price. However, the upcoming PCE Price Index release on Friday introduces an element of suspense to this narrative. This data release carries substantial implications for the market’s outlook on future interest rates, and any unexpected revelations could lead to a significant repricing of these expectations. Such a development has the potential to spark noteworthy directional movements in the gold price, adding an extra layer of excitement to the upcoming sessions.
Technical
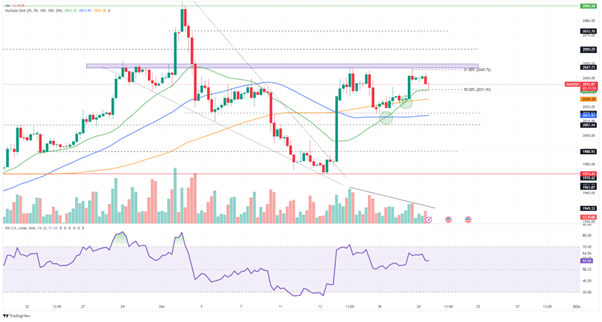
On the 4H chart, a breakout occurred at the falling wedge, with the spot price now consolidating in anticipation of its next directional move. The 25-SMA (green line) provides support at the lower end of the consolidation range around $2,031.93/ounce, which is also the Fibonacci midpoint. However, psychological resistance at $2,045.72/ounce, the Fibonacci golden ratio is keeping the sellers in play, creating an interesting setup for the upcoming week.
Should the spot price fall below the 25-SMA, a retracement of the wedge breakout could be initiated. Support at $2,015.54/ounce and the 50-SMA (blue line) at $2,013.92/ounce could be levels of interest in the upcoming sessions, as a breakdown below could result in a retest of $1,988.93/ounce, where the initial breakout from the wedge occurred.
However, should the price move above the supply zone near the Fibonacci golden ratio of $2,045.72/ounce, it could signal a potential continuation of the recent uptrend. The first hurdle to this play could be the resistance at $2,060.20/ounce before the price could move toward its previous highs at $2,072.70/ounce and $2,090.28/ounce in the longer term.
Summary
The gold spot price has entered a consolidation phase, anticipating the release of the crucial PCE data later this week. Until the market receives more clarity from this event, the sideways price action could continue, with support at $2,031.93/ounce and resistance at $2,045.72/ounce acting as pivotal levels to the spot price’s trend.
Sources: Koyfin, Tradingview
Piece written by Tiaan van Aswegen, Trive Financial Market Analyst
Disclaimer: Trive South Africa (Pty) Ltd, Registration number 2005/011130/07, and an Authorised Financial Services Provider in terms of the Financial Advisory and Intermediary Services Act 2002 (FSP No. 27231). Any analysis/data/opinion contained herein are for informational purposes only and should not be considered advice or a recommendation to invest in any security. The content herein was created using proprietary strategies based on parameters that may include price, time, economic events, liquidity, risk, and macro and cyclical analysis. Securities involve a degree of risk and are volatile instruments. Market and economic conditions are subject to sudden change, which may have a material impact on the outcome of financial instruments and may not be suitable for all investors. When trading or investing in securities or alternative products, the value of the product can increase or decrease meaning your investment can increase or decrease in value. Past performance is not an indication of future performance. Trive South Africa (Pty) Ltd, and its employees assume no liability for any loss or damage (direct, indirect, consequential, or inconsequential) that may be suffered from using or relying on the information contained herein. Please consider the risks involved before you trade or invest.