The Home Depot (NYSE: HD) navigates a diverse landscape with an established brand and robust financials despite recent dips in net earnings. The recent acquisition move by The Home Depot to acquire International Designs Group reflects its strategic move to target the professional contractor segment within the $950 billion home improvement market. This shift aims to increase transaction sizes by focusing on larger projects.
HD faces challenges in a cautious consumer spending environment, impacting sales of higher-value items, compounded by its reliance on the domestic market. Sustaining growth amid declining net earnings and income calls for continual innovation to address evolving consumer needs and market dynamics. However, opportunities in expanding e-commerce and international markets offer growth potential, while threats loom from economic downturns and competitive pressures.
Despite these challenges, HD’s robust financial standing and diversified product offerings position it well to navigate the competitive landscape and capitalize on market opportunities.
Technical Analysis
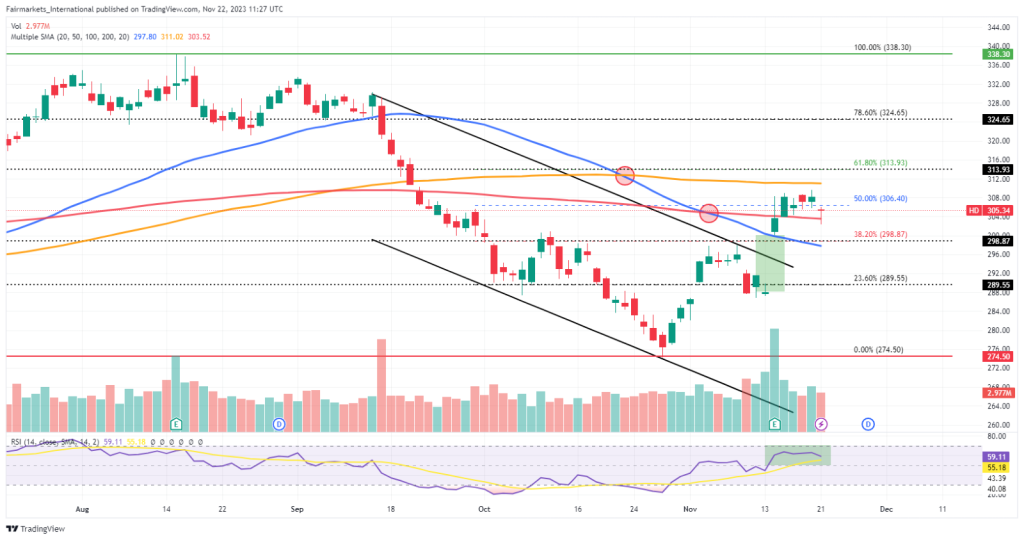
Currently trading at approximately $305.34, the daily chart shows that HD’s stock price hovers around the critical 200-SMA (red line) and a significant 50% Fibonacci retracement level following a successful earnings-induced break above the descending channel trading pattern. While positioned above the 50-SMA (blue line) and 200-SMA, it trails beneath the 100-SMA (orange line). A recent downward shift in the 50-SMA indicates potential short-term weakness in the stock’s performance. The Relative Strength Index (RSI) stands at 59.11, trending upward but approaching overbought levels.
In terms of potential scenarios, short-term trading opportunities towards the 61.80% Fibonacci retracement level at $313.93 could arise should the bulls sustain a push above the 50% Fibonacci retracement level. A break above the initial resistance could confirm the bullish momentum, likely bringing the $324.65 and $338.30 resistance levels within the bulls’ reach in the short term.
With the price action trading around the 200-SMA and 50% Fibonacci retracement level, there is potential for a short-term pullback to the 38.20% Fibonacci retracement level at $298.87. A break below the initial support could initiate the recent gap-filling and would likely bring the $289.55 and $274.50 support levels into play.
Summary
With Home Depot’s price situated around crucial levels, HD’s trading outlook reflects a balance between bullish and bearish sentiments. Key resistance levels at $313.93 and $324.65 may come into play if bullish momentum persists. Conversely, a potential pullback could see support levels at $298.87. Investors should monitor the $298.87 support level closely, as a breach may signal a further downward movement towards $289.55. and $274.50.
Overall, the company’s fundamental strength supports potential upside moves, yet caution is warranted, given technical indicators indicating a potential short-term pullback.
Sources: TradingView, Dow Jones Newswire, Harmony Gold Mining Company, Investing.com, Reuters, MT Newswire, PR Newswire, Seeking Alpha, BusinessLive.
Piece written by Mfanafuthi Mhlongo, Trive Financial Market Analyst
Disclaimer: Trive South Africa (Pty) Ltd, Registration number 2005/011130/07, and an Authorised Financial Services Provider in terms of the Financial Advisory and Intermediary Services Act 2002 (FSP No. 27231). Any analysis/data/opinion contained herein are for informational purposes only and should not be considered advice or a recommendation to invest in any security. The content herein was created using proprietary strategies based on parameters that may include price, time, economic events, liquidity, risk, and macro and cyclical analysis. Securities involve a degree of risk and are volatile instruments. Market and economic conditions are subject to sudden change, which may have a material impact on the outcome of financial instruments and may not be suitable for all investors. When trading or investing in securities or alternative products, the value of the product can increase or decrease meaning your investment can increase or decrease in value. Past performance is not an indication of future performance. Trive South Africa (Pty) Ltd, and its employees assume no liability for any loss or damage (direct, indirect, consequential, or inconsequential) that may be suffered from using or relying on the information contained herein. Please consider the risks involved before you trade or invest.