Hulamin Limited (JSE: HLM) finds itself at a critical juncture following a period of consolidation, poised for a potential shift in its trajectory. In its recent half-year earnings report for the six months ended 30 June 2023, the company showcased a remarkable surge in operating profit from R223.2M to R473.5M, consequently bolstering earnings per share from R0.47 to R0.95. However, despite this positive performance, there were notable challenges; group volumes saw a decline of 7% to 95,588 tons, while the average rand aluminium price dropped by 11%, resulting in a contraction in overall revenue from R7.96Bn to R7.40Bn.
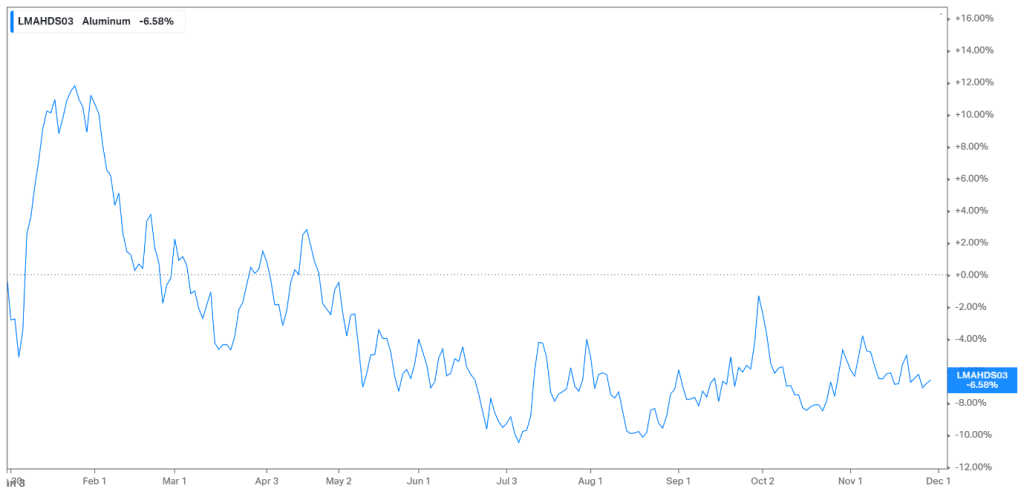
The landscape for aluminium appears strained, evident from the chart below illustrating a 6% decline in the futures this year. These circumstances may present obstacles in the next six months. The pivotal question remains: can Hulamin navigate these challenges to revitalize its revenue and, in turn, restore investor confidence in its operations?
Technical
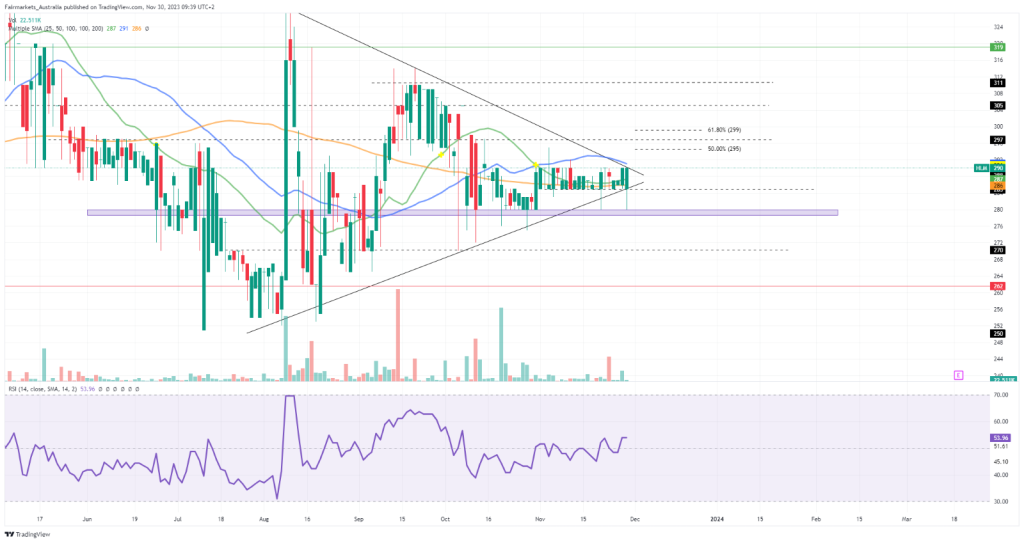
On the 1D chart, a symmetrical triangle has emerged, with the price pushing close to the dynamic resistance of the triangle, which is backed by the 50-SMA at R2.90. While this is a challenging resistance level to breach, the 25-SMA (green line) and 100-SMA (orange line) provide support close to R2.85, creating an intriguing technical setup.
A breakout above the 50-SMA could result in a retracement of the prior downtrend toward the Fibonacci midpoint at R2.95. Higher resistance at R2.97 stands in the way of a test at the Fibonacci golden ratio of R2.99, which could provide stern resistance to the breakout’s sustainability.
On the other hand, failure to move above the 50-SMA might trigger a selloff below the support at R2.85, causing a triangle breakdown. A demand zone is established at R2.80, which could hold some buyers, but a leg below this zone could result in a longer-term downturn, bringing support at R2.70 and R2.62 into the spotlight.
Summary
Hulamin Limited finds itself at a technical inflexion point after a relatively flat month of consolidation. The key levels to look out for are the 50-SMA resistance at R2.90 and support at R2.85, as a breach of either of these levels could trigger a breakout from the triangle pattern.
Sources: Koyfin, Tradingview, Hulamin Limited
Piece written by Tiaan van Aswegen, Trive Financial Market Analyst
Disclaimer: Trive South Africa (Pty) Ltd, Registration number 2005/011130/07, and an Authorised Financial Services Provider in terms of the Financial Advisory and Intermediary Services Act 2002 (FSP No. 27231). Any analysis/data/opinion contained herein are for informational purposes only and should not be considered advice or a recommendation to invest in any security. The content herein was created using proprietary strategies based on parameters that may include price, time, economic events, liquidity, risk, and macro and cyclical analysis. Securities involve a degree of risk and are volatile instruments. Market and economic conditions are subject to sudden change, which may have a material impact on the outcome of financial instruments and may not be suitable for all investors. When trading or investing in securities or alternative products, the value of the product can increase or decrease meaning your investment can increase or decrease in value. Past performance is not an indication of future performance. Trive South Africa (Pty) Ltd, and its employees assume no liability for any loss or damage (direct, indirect, consequential, or inconsequential) that may be suffered from using or relying on the information contained herein. Please consider the risks involved before you trade or invest.