Are JSE clothing retailers making a comeback at the start of the new year, or are the current share price movements just a flight of fancy before the complex realities of global recessions filter through?
With inflation being the buzzing topic of conversation amongst most market participants, many investors are understandably searching for companies and sectors that have been able to mitigate against the relentless rise in general price levels.
While 2023 is still expected to be a year in which high-interest rates persist, the South African clothing retail industry has caught the attention of many financial market analysts. Despite inflationary pressure being rife within the local food retail industry, with general food prices having been hard hit by the ongoing Russia-Ukraine conflict, clothing retailers have been able to better weather down the effects of the rising price environment.
Let’s look at two JSE Clothing Retail Sector shares making the headlines this week:
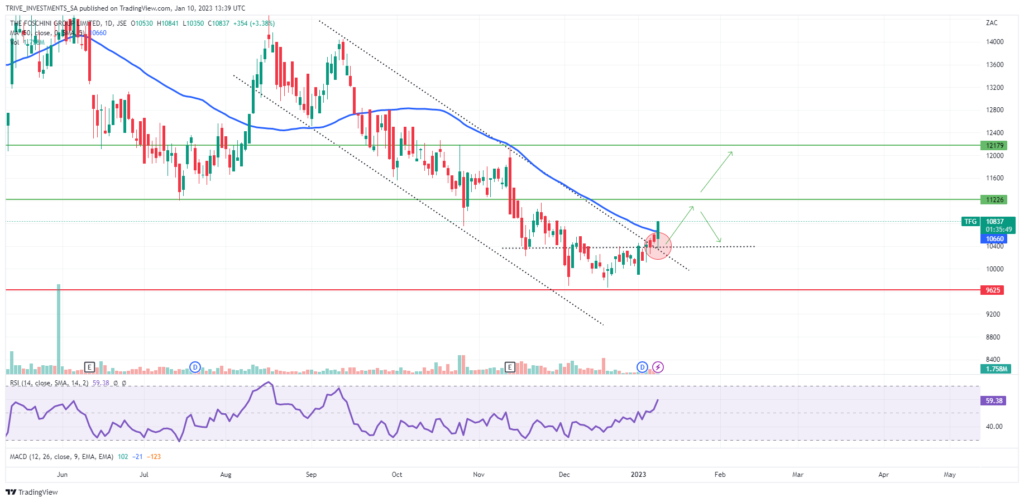
The Foschini Group Limited (JSE: TFG)
TFG Limited, also known as The Foschini Group, a South African JSE-listed clothing retailer, increased its basic earnings per share (EPS) by a healthy 44.5% year-on-year. Additionally, the group’s 23% year-on-year increase in revenue has captured the attention of many market participants.
Technicals
The price action on Foschini has been trading in a descending channel since August 2022, which has seen a breakout (red circle) out of the downtrend. The price breakout could see traders rushing to the retailer, driving the price higher to the next resistance point at R112.26 a share. This resistance point will be watched closely for a retracement, which could attract short sellers to lower the price back to the breakout level.
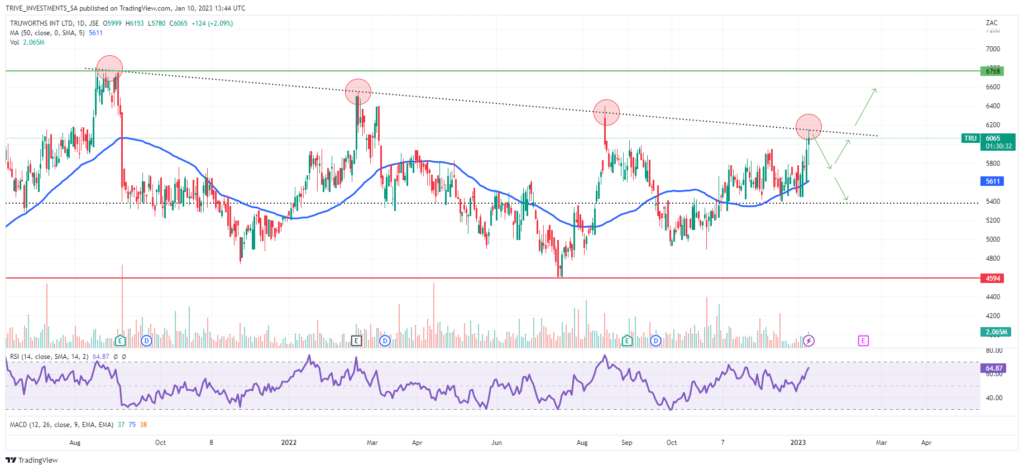
Truworths International Limited (JSE: TRU)
Truworths, the Cape Town-based South African clothing retailer, is gaining the attention of many market participants and potential investors. The group had an awe-inspiring 2022 financial year, with basic earnings per share (EPS) increasing by approximately 65% year-on-year. Furthermore, the group’s 2022 price-earnings (PE) ratio of 6 is the lowest it’s been in more than ten years, signalling a relatively low share price in relation to earnings. Not only is the group’s PE ratio at a ten-year low, but its latest return on equity and return on capital figures come in at a ten-year high. For the 2022 financial year ended, Truworths increased its return on equity from 32% a year prior to 50%, while its return on capital increased from 50% to 72%.
Technicals
Truworths has been consolidating sideways since September 2022 after reaching the major resistance level at R67.68 per share. The price action has been trending lower, forming a technical triangle pattern that needs to see buyers enter the market to push the price through the descending trend line (red circles). If the rejection of the trend line persists, then short sellers could be set for an opportunity to lower the price to R57.50 a share. If the bulls take control, we could see a long opportunity back to the significant resistance level at R67.68.
Sources: The Foschini Group Limited, Truworths International Limited, Moneyweb, News24, TradingView.
Disclaimer: Trive South Africa (Pty) Ltd, Registration number 2005/011130/07, and an Authorised Financial Services Provider in terms of the Financial Advisory and Intermediary Services Act 2002 (FSP No. 27231). Any analysis/data/opinion contained herein are for informational purposes only and should not be considered advice or a recommendation to invest in any security. The content herein was created using proprietary strategies based on parameters that may include price, time, economic events, liquidity, risk, and macro and cyclical analysis. Securities involve a degree of risk and are volatile instruments. Market and economic conditions are subject to sudden change which may have a material impact on the outcome of financial instruments and may not be suitable for all investors. When trading or investing in securities or alternative products, the value of the product can increase or decrease meaning your investment can increase or decrease in value. Past performance is not an indication of future performance. Trive South Africa (Pty) Ltd, and its employees assume no liability for any loss or damage (direct, indirect, consequential, or inconsequential) that may be suffered from using or relying on the information contained herein. Please consider the risks involved before you trade or invest.