Meta Platforms Inc (NASDAQ: META) recently made headlines with its latest earnings report, beating Wall Street’s earnings expectations while marginally surpassing revenue projections.
The tech giant reported earnings of $4.71 per share, exceeding expectations by nearly 10%. Impressively, its revenue for the quarter ending March 31 reached $36.46 billion, a notable increase from $28.65 billion a year earlier, marking a significant 27% gain year-over-year. Additionally, Meta reported a rise in Family Daily Active People to 3.24 billion in the first quarter, reflecting a 7% increase compared to the previous year. Ad impressions also saw a substantial uptick, rising by 20% year-over-year, with the average price per ad up by 6%.
Despite these positive metrics, the company’s share price has plummeted nearly 14% in pre-market hours, resulting in a loss of almost $200 billion in market capitalization. This decline was likely attributed to forecasts of higher expenses and lighter revenue than expected, as investors weighed the cost-benefit analysis of Meta’s AI roadmap against its financial performance. The company anticipates increased capital spending to support its artificial intelligence initiatives, indicating a strategic focus on long-term growth and innovation.
Technical
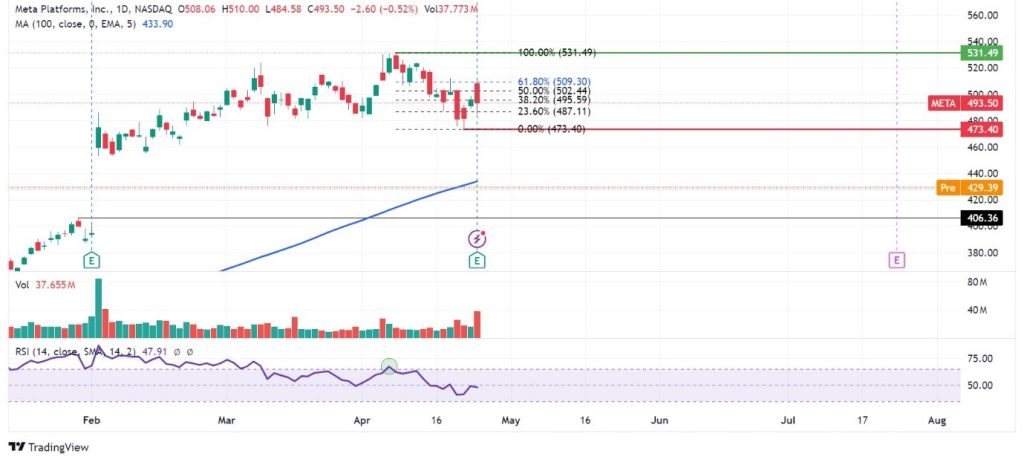
Meta Platforms has been riding a bullish wave, with its share price soaring by nearly 40% year-to-date, fuelled by a robust uptrend.
Surpassing the 100-day moving average, the share price surged to an all-time high of $531.49 per share, reflecting the market’s optimism and bullish sentiment. However, this bullish momentum hit a roadblock as overbought RSI conditions emerged, triggering a downturn in the share price.
As a result, the share price experienced a significant pullback, plummeting by as much as 10% from its peak. Nevertheless, support emerged at the $473.40 per share level, signalling a potential reversal in fortunes. Indeed, a rebound occurred, with the share price retracing towards the 61.80% Fibonacci Retracement Golden Ratio level. However, negative sentiment surrounding the stock led to a bearish reversal at the Golden Ratio. The share price broke below the support level in pre-market hours, aligning with the 100-day moving average. Should downside momentum persist, the $406.36 per share level could serve as a point of interest to the downside. In contrast, a resurgence of upside momentum could spark a rebound, with the $473.40 per share level potentially attracting interest to the upside.
Summary
Despite solid financial results, Meta Platforms faced a significant setback as its share price plummeted nearly 14% in pre-market hours, erasing almost $200 billion in market capitalization. The $406.36 per share level could serve as a point of interest to the downside if bearish forces persist.
Sources: Meta Platforms Inc, Reuters, CNBC, Forbes, TradingView
Piece Written By Nkosilathi Dube, Trive Financial Market Analyst
Disclaimer: Trive South Africa (Pty) Ltd (hereinafter referred to as “Trive SA”), with registration number 2005/011130/07, is an authorised Financial Services Provider in terms of the Financial Advisory and Intermediary Services Act, 37 of 2002. Trive SA is authorised and regulated by the South African Financial Sector Conduct Authority (FSCA) and holds FSP number 27231. Trive Financial Services Ltd (hereinafter referred to as “Trive MU”) holds an Investment Dealer (Full-Service Dealer, excluding Underwriting) Licence with licence number GB21026295 pursuant to section 29 of the Securities Act 2005, Rule 4 of the Securities Rules 2007, and the Financial Services Rules 2008. Trive MU is authorized and regulated by the Mauritius Financial Services Commission (FSC) and holds Global Business Licence number GB21026295 under Section 72(6) of the Financial Services Act. Trive SA and Trive MU are collectively known and referred to as “Trive Africa”.
Market and economic conditions are subject to sudden change which may have a material impact on the outcome of financial instruments and may not be suitable for all investors. Trive Africa and its employees assume no liability for any loss or damage (direct, indirect, consequential, or inconsequential) that may be suffered. Please consider the risks involved before you trade or invest. All trades on the Trive Africa platform are subject to the legal terms and conditions to which you agree to be bound. Brand Logos are owned by the respective companies and not by Trive Africa. The use of a company’s brand logo does not represent an endorsement of Trive Africa by the company, nor an endorsement of the company by Trive Africa, nor does it necessarily imply any contractual relationship. Images are for illustrative purposes only and past performance is not necessarily an indication of future performance. No services are offered to stateless persons, persons under the age of 18 years, persons and/or residents of sanctioned countries or any other jurisdiction where the distribution of leveraged instruments is prohibited, and citizens of any state or country where it may be against the law of that country to trade with a South African and/or Mauritius based company and/or where the services are not made available by Trive Africa to hold an account with us. In any case, above all, it is your responsibility to avoid contravening any legislation in the country from where you are at the time.
CFDs and other margin products are complex instruments and come with a high risk of losing money rapidly due to leverage. You should consider whether you understand how these products work and whether you can afford to take the high risk of losing your money. Professional clients can lose more than they deposit. See our full Risk Disclosure and Terms of Business for further details. Some or all of the services and products are not offered to citizens or residents of certain jurisdictions where international sanctions or local regulatory requirements restrict or prohibit them.