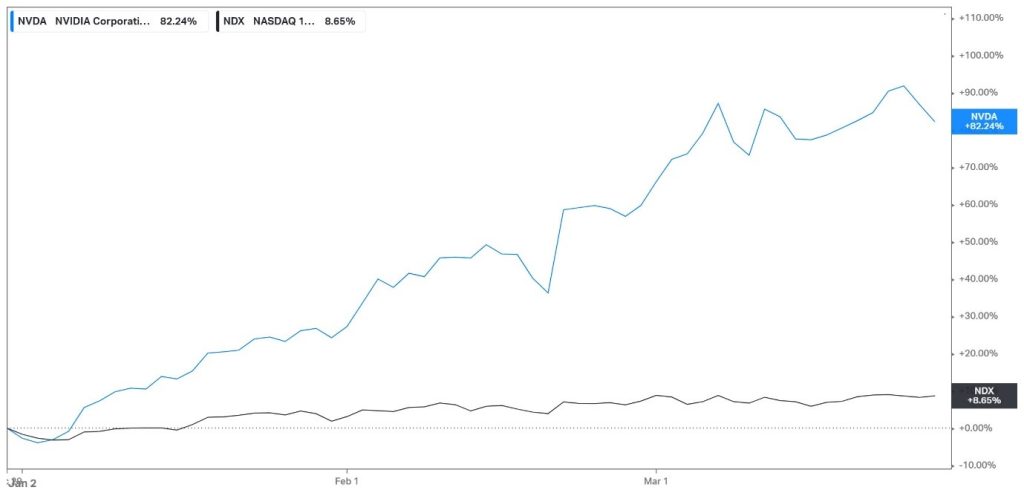
Nvidia Corporation (NASDAQ: NVDA) has been commanding attention with its remarkable performance, soaring to become the third most valuable company in the US, trailing only behind tech behemoths Microsoft and Apple. Boasting an impressive 82.24% surge in share price year-to-date, it has outpaced the tech-heavy Nasdaq 100 Index by an astounding tenfold, underlining its dominance in the sector.
Bolstered by eleven consecutive weeks of gains, Nvidia rides the crest of market confidence in Artificial Intelligence (AI) prospects, where it stands at the forefront. The recent financial report further fuelled this momentum, surpassing expectations and showcasing robust growth in both revenue and earnings. Holding a commanding 80% market share in advanced AI chip technology solidifies its position as an industry leader.
However, amidst its stellar run, Nvidia faces potential headwinds this week, with reports of company insiders selling positions contributing to a 4.28% decline week-to-date. This shift raises questions about market sentiment, particularly as investors await the release of the PCE Price Index, a crucial gauge of inflation favoured by the Federal Reserve.
Technical
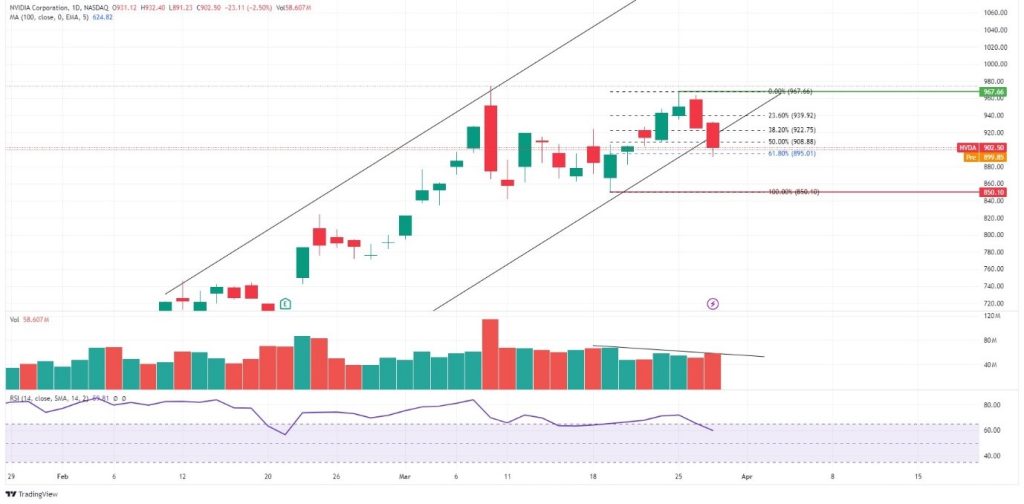
Nvidia’s share price has been on an upward trajectory, firmly positioned above the 100-day moving average, affirming its uptrend. The presence of an ascending channel pattern further validates this bullish momentum.
Following a minor dip, support materialised at the $850.10 per share level, catalysing a resurgence in buying activity. However, as the share price approached the $967.66 per share resistance level, upside momentum encountered resistance amid declining upside volumes. This culminated in a retracement, leading to back-to-back days of losses.
Presently, the share price has retraced to the 61.80% Fibonacci Retracement Golden Ratio, serving as a potential intermediate support level. Whether this level holds significance hinges on the resurgence of upside momentum. If so, a potential retest of the $967.66 per share resistance level looms on the horizon. Conversely, a breakdown below the Golden Ratio, accompanied by high volumes, could signal sustained selling pressures. In such a scenario, the $850.10 per share support level may come into play once again, potentially serving as a critical level for traders to watch.
Summary
Nvidia’s meteoric rise showcases its dominance in AI technology, surpassing market expectations with an 82.24% surge in share price. Despite recent setbacks, technical indicators suggest potential support at the $850.10 level and resistance at $967.66, underlining its resilience amid market fluctuations. Traders likely await key economic indicators for further cues.
Sources: Nvidia Corporation, Reuters, Koyfin, TradingView
Piece Written By Nkosilathi Dube, Trive Financial Market Analyst
Disclaimer: Trive South Africa (Pty) Ltd (hereinafter referred to as “Trive SA”), with registration number 2005/011130/07, is an authorised Financial Services Provider in terms of the Financial Advisory and Intermediary Services Act, 37 of 2002. Trive SA is authorised and regulated by the South African Financial Sector Conduct Authority (FSCA) and holds FSP number 27231. Trive Financial Services Ltd (hereinafter referred to as “Trive MU”) holds an Investment Dealer (Full-Service Dealer, excluding Underwriting) Licence with licence number GB21026295 pursuant to section 29 of the Securities Act 2005, Rule 4 of the Securities Rules 2007, and the Financial Services Rules 2008. Trive MU is authorized and regulated by the Mauritius Financial Services Commission (FSC) and holds Global Business Licence number GB21026295 under Section 72(6) of the Financial Services Act. Trive SA and Trive MU are collectively known and referred to as “Trive Africa”.
Market and economic conditions are subject to sudden change which may have a material impact on the outcome of financial instruments and may not be suitable for all investors. Trive Africa and its employees assume no liability for any loss or damage (direct, indirect, consequential, or inconsequential) that may be suffered. Please consider the risks involved before you trade or invest. All trades on the Trive Africa platform are subject to the legal terms and conditions to which you agree to be bound. Brand Logos are owned by the respective companies and not by Trive Africa. The use of a company’s brand logo does not represent an endorsement of Trive Africa by the company, nor an endorsement of the company by Trive Africa, nor does it necessarily imply any contractual relationship. Images are for illustrative purposes only and past performance is not necessarily an indication of future performance. No services are offered to stateless persons, persons under the age of 18 years, persons and/or residents of sanctioned countries or any other jurisdiction where the distribution of leveraged instruments is prohibited, and citizens of any state or country where it may be against the law of that country to trade with a South African and/or Mauritius based company and/or where the services are not made available by Trive Africa to hold an account with us. In any case, above all, it is your responsibility to avoid contravening any legislation in the country from where you are at the time.
CFDs and other margin products are complex instruments and come with a high risk of losing money rapidly due to leverage. You should consider whether you understand how these products work and whether you can afford to take the high risk of losing your money. Professional clients can lose more than they deposit. See our full Risk Disclosure and Terms of Business for further details. Some or all of the services and products are not offered to citizens or residents of certain jurisdictions where international sanctions or local regulatory requirements restrict or prohibit them.