
In the most recent chapter of its financial story, Old Mutual Limited (JSE: OMU) has revealed a remarkable 14% surge in its revenue. This impressive feat was made possible by combining enhanced productivity levels and an unexpectedly robust performance in generating new business value. Old Mutual navigated through the turbulent waters of the macroeconomic landscape, emerging not only unscathed but even more resilient than before. Though the company typically thrives in periods of higher interest rates, recent shifts in consumer budgets have somewhat tempered its gains. Yet, the question that lingers is whether Old Mutual can maintain its growth trajectory amidst the ongoing uncertainty of the macroeconomic landscape, as confirmed by its management’s cautious outlook.
For the half year ended 30 June 2023, the company reported profit attributable to shareholders of R4.35Bn, falling from the year-ago period’s R4.83Bn. A slow post-pandemic economic recovery and elevated inflation and borrowing costs have pressured the consumer’s disposable income. While Old Mutual typically benefits from higher rates due to the increased return on investments of its collected premiums, the effect on the consumer’s income has capped these gains.
However, its results from operation expanded by 3% to R4.4Bn, with a 16% expansion in gross written premiums to R12.6Bn. Insurance revenue advanced from R30.65Bn to R33.27Bn, with the value of the new business margin increasing by 40bps to 2.6%, showcasing resilient profitability in its new policies. With a solvency ratio of 186%, investors are assured of the company’s ability to meet its claims, which rounds off an overall solid half-year performance.
Technical
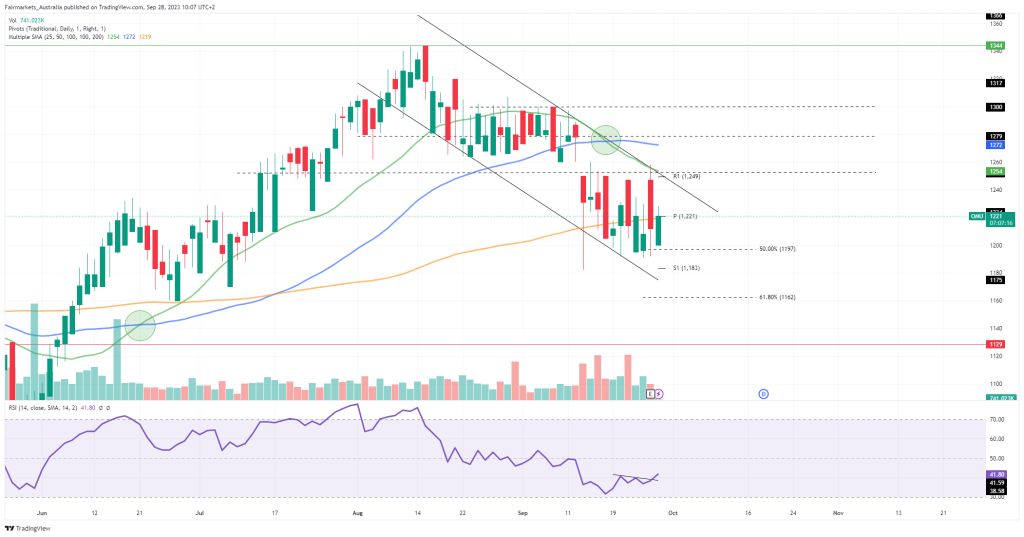
On the 1D chart, a descending channel has formed, as a new downtrend has emerged from its peak in August. The 50-SMA (blue line) trades above the 25-SMA (green line), suggesting bearish momentum. However, with support from the Fibonacci midpoint at R11.97, the daily pivot point at R12.21 could be vulnerable to a bullish shift in the intraday momentum.
A breakout above R12.21 could lead the price toward the dynamic resistance at R12.49. If resistance holds, a pullback toward R11.83 (S1) could result in a continuation of the current channel. The 61.8% Fibonacci golden ratio at R11.62 could then come into play, potentially preventing any further downside toward R11.29.
However, if resistance at R12.49 fails to withhold the bullish push, the share price could advance toward R12.79 and R13.00, reversing the current trend. Higher resistance is established at R13.44, where the price could potentially retest the resistance level it previously failed to breach.
Summary
After posting a solid half-year earnings report, Old Mutual has displayed resilience in navigating a challenging business environment. As we advance, the key level to look out for is R12.49, the resistance at the descending channel, where a potential pullback toward R11.83 could be initiated. Conversely, a breakout from the channel could potentially lead the price toward R12.79 and R13.00.
Sources: Koyfin, Tradingview, Old Mutual Limited
Piece written by Tiaan van Aswegen, Trive Financial Market Analyst
Disclaimer: Trive South Africa (Pty) Ltd, Registration number 2005/011130/07, and an Authorised Financial Services Provider in terms of the Financial Advisory and Intermediary Services Act 2002 (FSP No. 27231). Any analysis/data/opinion contained herein are for informational purposes only and should not be considered advice or a recommendation to invest in any security. The content herein was created using proprietary strategies based on parameters that may include price, time, economic events, liquidity, risk, and macro and cyclical analysis. Securities involve a degree of risk and are volatile instruments. Market and economic conditions are subject to sudden change, which may have a material impact on the outcome of financial instruments and may not be suitable for all investors. When trading or investing in securities or alternative products, the value of the product can increase or decrease meaning your investment can increase or decrease in value. Past performance is not an indication of future performance. Trive South Africa (Pty) Ltd, and its employees assume no liability for any loss or damage (direct, indirect, consequential, or inconsequential) that may be suffered from using or relying on the information contained herein. Please consider the risks involved before you trade or invest.