Woolworths Holdings Limited (JSE: WHL) presents an intriguing scenario with a P/E ratio of 15.5x, notably higher than the South African market average. This elevated P/E reflects investors’ optimism about sustained robust earnings growth. Over the last year, Woolworths displayed a 15% earnings surge and an impressive 637% aggregate EPS increase over three years. However, forecasted growth of 8.6% for the next three years lags behind the broader market’s anticipated 12% expansion, suggesting a potential disconnect between the stock’s valuation and future growth prospects.
Moreover, the company faced operational challenges, including disruptions from strikes, port congestion, and supply chain issues due to Avian flu. These hurdles contributed to a 22.4% sales decrease in a recent reporting period.
Technical Analysis
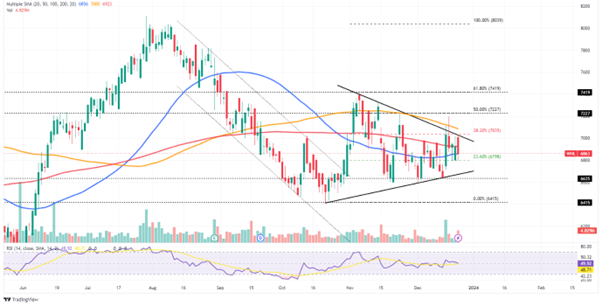
On the 1-day chart, Woolworths’ stock currently trades at 6,863 cents, confined within a symmetric triangle pattern. The price hovers near the 50-SMA (blue line), below the 100-SMA (orange line) and 200-SMA (red line), indicating a neutral trend. The RSI at 49.92 reflects neutral market sentiment.
With the price action confined within the 23.60% and 38.20% Fibonacci retracement level, there could be potential for opportunities in both directions. Therefore, a push above the triangle and a break above the 38.20% Fibonacci retracement level could offer trading opportunities towards the resistance at 7,227 cents. A successful break above the initial resistance would likely bring the 7,419 cents resistance level within the bulls’ reach in the short term.
However, short-term trading opportunities towards the 6,635 cents support level could arise should the price action sustain a push below the 23.60% Fibonacci retracement level and triangle. A break below the initial support level would bring the 6,415 cent support level into play in the short term.
Summary
Woolworths Holdings’ stock faces a valuation challenge with an elevated P/E ratio despite forecasted growth trailing the broader market. Recent operational setbacks and technical patterns suggest neutral short-term sentiment.
Key levels to watch include resistance at 7,227 cents and 7,419 cents, with support at 6,635 cents and 6,415 cents, potentially indicating trading opportunities based on a breakout in either direction.
Sources: TradingView, Trading Economics, Office for National Statistics, Reuters, MT Newswire.
Piece written by Mfanafuthi Mhlongo, Trive Financial Market Analyst
Disclaimer: Trive South Africa (Pty) Ltd (hereinafter referred to as “Trive SA”), with registration number 2005/011130/07, is an authorised Financial Services Provider in terms of the Financial Advisory and Intermediary Services Act, 37 of 2002. Trive SA is authorised and regulated by the South African Financial Sector Conduct Authority (FSCA) and holds FSP number 27231. Trive Financial Services Ltd (hereinafter referred to as “Trive MU”) holds an Investment Dealer (Full-Service Dealer, excluding Underwriting) Licence with licence number GB21026295 pursuant to section 29 of the Securities Act 2005, Rule 4 of the Securities Rules 2007, and the Financial Services Rules 2008. Trive MU is authorized and regulated by the Mauritius Financial Services Commission (FSC) and holds Global Business Licence number GB21026295 under Section 72(6) of the Financial Services Act. Trive SA and Trive MU are collectively known and referred to as “Trive Africa”.
Market and economic conditions are subject to sudden change which may have a material impact on the outcome of financial instruments and may not be suitable for all investors. Trive Africa and its employees assume no liability for any loss or damage (direct, indirect, consequential, or inconsequential) that may be suffered. Please consider the risks involved before you trade or invest. All trades on the Trive Africa platform are subject to the legal terms and conditions to which you agree to be bound. Brand Logos are owned by the respective companies and not by Trive Africa. The use of a company’s brand logo does not represent an endorsement of Trive Africa by the company, nor an endorsement of the company by Trive Africa, nor does it necessarily imply any contractual relationship. Images are for illustrative purposes only and past performance is not necessarily an indication of future performance. No services are offered to stateless persons, persons under the age of 18 years, persons and/or residents of sanctioned countries or any other jurisdiction where the distribution of leveraged instruments is prohibited, and citizens of any state or country where it may be against the law of that country to trade with a South African and/or Mauritius based company and/or where the services are not made available by Trive Africa to hold an account with us. In any case, above all, it is your responsibility to avoid contravening any legislation in the country from where you are at the time.
CFDs and other margin products are complex instruments and come with a high risk of losing money rapidly due to leverage. You should consider whether you understand how these products work and whether you can afford to take the high risk of losing your money. Professional clients can lose more than they deposit. See our full Risk Disclosure and Terms of Business for further details. Some or all of the services and products are not offered to citizens or residents of certain jurisdictions where international sanctions or local regulatory requirements restrict or prohibit them.