The S&P 500 Index (CME: ES) is currently enjoying a positive outlook, backed by several fundamental tailwinds. The index is on a two-week winning streak, buoyed by in-line US inflation data and expectations of a potential Fed rate cut in June. The PCE price index, the Fed’s preferred gauge of inflation, rose 0.3% month-over-month in January, aligning with expectations and easing concerns about aggressive rate hikes. Additionally, comments from Atlanta Fed President Raphael Bostic and Chicago Fed President Austan Goolsbee, both voting members this year, reinforced the possibility of rate cuts later in 2024, further supporting the market’s bullish sentiment.
Furthermore, positive sentiment surrounding the technology sector, particularly those associated with Artificial Intelligence (AI), continues to fuel the market rally. Heavyweight chipmaker Nvidia and its smaller rival AMD surged on Thursday, contributing significantly to the index’s gains. This sector focus aligns with the broader market narrative of economic optimism and growth potential in the tech space.
Technical
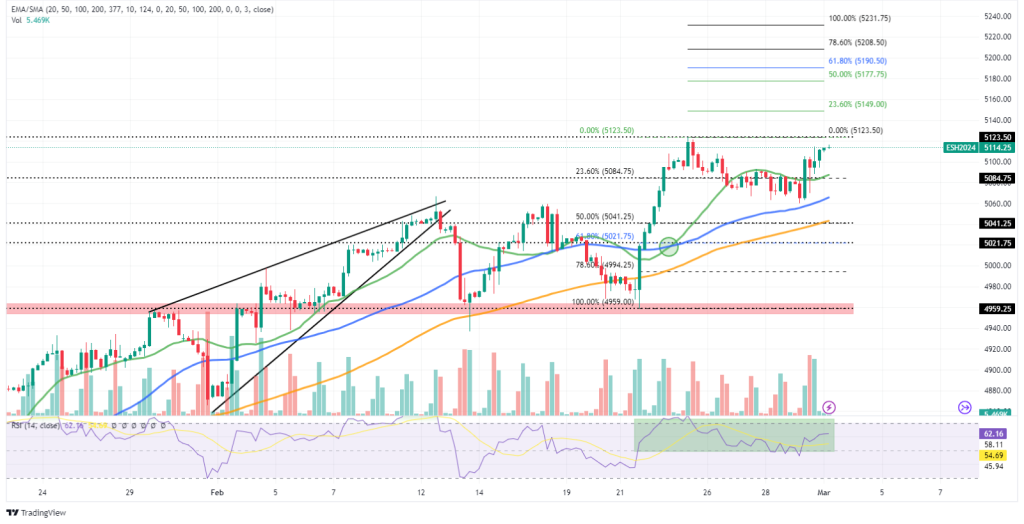
The 4-hour chart of the S&P 500 Index reveals a clear bullish bias. Currently trading at 5,114.25, the index’s price action is comfortably positioned above the 20-SMA (green line), 50-SMA (blue line), and 100-SMA (orange line), indicating sustained upward momentum. The recent crossover of the 20-SMA above the 50-SMA, coupled with an upward-sloping 100-SMA, underscores the strength of the current rally. The RSI, standing at 62.16, remains above the midpoint level of 50.00, suggesting that buying pressure prevails.
Short-term trading opportunities might exist towards the all-time high of 5,123.50 if the bullish momentum persists. A break above this resistance level could open the door towards the 23.60% Fibonacci extension level (5,149.00) and even the 50.00% Fibonacci extension level (5,177.75).
However, if the price action loses momentum and falls below the 20-SMA, it could find support at the 23.60% Fibonacci retracement level (5,084.75). A significant break below this level, coupled with high trading volume, could bring the 50.00% and 61.80% Fibonacci retracement levels (5,041.25 and 5,021.75) into play, signalling a potential trend reversal.
Summary
The S&P 500’s outlook remains positive in the short term, supported by both fundamental and technical factors. The index is likely to continue its upward trajectory towards an all-time high in the near future, with potential resistance at 5,123.50. However, a break below the 23.60% Fibonacci retracement level, accompanied by significant volume, could indicate a short-term pullback.
Sources: TradingView, Trading Economics, CNBC, Dow Jones Newswire, Reuters, Bureau of Economic Analysis.
Piece written by Mfanafuthi Mhlongo, Trive Financial Market Analyst
Disclaimer: Trive South Africa (Pty) Ltd (hereinafter referred to as “Trive SA”), with registration number 2005/011130/07, is an authorised Financial Services Provider in terms of the Financial Advisory and Intermediary Services Act, 37 of 2002. Trive SA is authorised and regulated by the South African Financial Sector Conduct Authority (FSCA) and holds FSP number 27231. Trive Financial Services Ltd (hereinafter referred to as “Trive MU”) holds an Investment Dealer (Full-Service Dealer, excluding Underwriting) Licence with licence number GB21026295 pursuant to section 29 of the Securities Act 2005, Rule 4 of the Securities Rules 2007, and the Financial Services Rules 2008. Trive MU is authorized and regulated by the Mauritius Financial Services Commission (FSC) and holds Global Business Licence number GB21026295 under Section 72(6) of the Financial Services Act. Trive SA and Trive MU are collectively known and referred to as “Trive Africa”.
Market and economic conditions are subject to sudden change which may have a material impact on the outcome of financial instruments and may not be suitable for all investors. Trive Africa and its employees assume no liability for any loss or damage (direct, indirect, consequential, or inconsequential) that may be suffered. Please consider the risks involved before you trade or invest. All trades on the Trive Africa platform are subject to the legal terms and conditions to which you agree to be bound. Brand Logos are owned by the respective companies and not by Trive Africa. The use of a company’s brand logo does not represent an endorsement of Trive Africa by the company, nor an endorsement of the company by Trive Africa, nor does it necessarily imply any contractual relationship. Images are for illustrative purposes only and past performance is not necessarily an indication of future performance. No services are offered to stateless persons, persons under the age of 18 years, persons and/or residents of sanctioned countries or any other jurisdiction where the distribution of leveraged instruments is prohibited, and citizens of any state or country where it may be against the law of that country to trade with a South African and/or Mauritius based company and/or where the services are not made available by Trive Africa to hold an account with us. In any case, above all, it is your responsibility to avoid contravening any legislation in the country from where you are at the time.
CFDs and other margin products are complex instruments and come with a high risk of losing money rapidly due to leverage. You should consider whether you understand how these products work and whether you can afford to take the high risk of losing your money. Professional clients can lose more than they deposit. See our full Risk Disclosure and Terms of Business for further details. Some or all of the services and products are not offered to citizens or residents of certain jurisdictions where international sanctions or local regulatory requirements restrict or prohibit them.