The FTSE100 (LSE: UKX) has been subdued by the Bank of England’s decision to hike rates by 25 basis points (bps) today. Although the UK has been struggling with persistently high inflation, headline and core inflation cooled after the BoE aggressively hiked interest rates by 50 bps last month. Notably, eight of the nine monetary policy committee members voted in favour of the rate hike, raising concerns about the possibility of further increases before the end of the year.
Headline and core inflation reported lower-than-expected figures of 7.9% and 6.9%, respectively, after the BoE’s last interest rate increase. However, inflation remains high, exceeding the 2% target, prompting another hike this month. Additionally, earnings releases have been muted as 94% of the companies within the index are trading in the red due to poor earnings releases and the country’s ongoing struggle with inflation. While prospects of further rate hikes may push the UK into a recession, high inflation is a more pressing issue for the BoE.
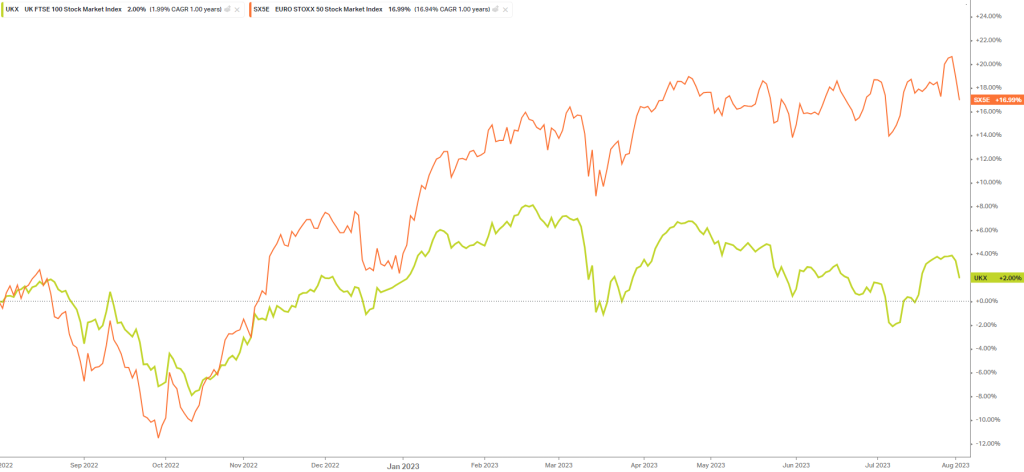
UK FTSE 100 vs EURO STOXX 50
Looking at the charts below, we can see that the two Indices look very similar, but the Euro Stoxx 50 (SX5E) (orange line) has been diverging from the FTSE 100 (UKX) (green line). The UK’s FTSE 100 performance over the last year is under 2%, while the Euro Stoxx 50 has gained around 16% over the same period.
After printing a new all-time high earlier this week, the Euro Stoxx 50 has retraced sharply as the deteriorating fundamental picture continues. Core inflation remains high in the Eurozone, which could see the ECB increase or maintain higher interact rates risking the possibility of a recession.
The latest BoE report showed that the UK is not forecasting a recession, but looking at the data, the risk of the economy moving into one is significant after the latest 25-basis point rate hike.
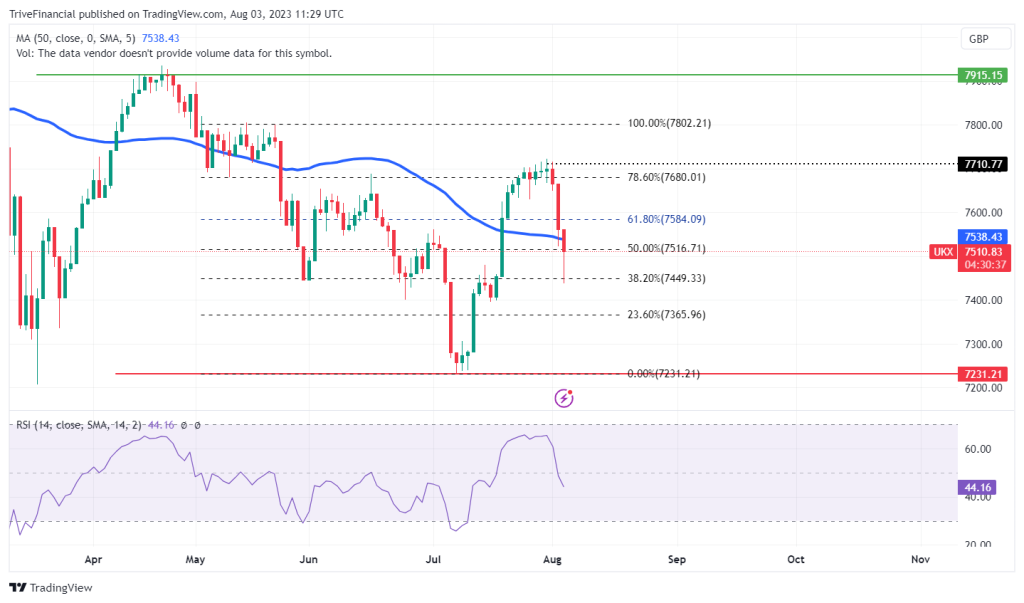
UK FTSE 100 Technicals
A downward trend is in full swing on the 1D Chart, with significant support and resistance established at 7,231.21 and 7,915.15, respectively. Bullish momentum attempted to stage a reversal but was met with resistance at the 7,710.77 level, which encouraged a pullback towards the 7,449.33 support at the 38.20% Fibonacci level.
Since the price action established support at the previous resistance level of 7,449.33, a breakdown of this level may encourage further downside momentum towards the 7,231.21 major support, as the index intersected below the 50-day moving average. However, the 7,449.33 or 7,231.21 support levels could hold, which may encourage a leg up towards the 7,710.77 resistance, marking a possible pivot point towards the 7,915.15 major resistance.
Summary
The FTSE100 is slipping further into the red on the backdrop of poor earnings and the BoE’s decision to hike rates. If the downward trend continues, the 25-basis point hike may succumb to the index to the 7,231.21 significant support. However, the 7,449.33 level could hold, encouraging a leg up towards the 7,710.77 resistance.
Sources: TradingView, Office for National Statistics, Trading Economics, Reuters, Fidelity
Piece was written by Alexa Smith, Trive Financial Market Analyst.
Disclaimer: Trive South Africa (Pty) Ltd, Registration number 2005/011130/07, and an Authorised Financial Services Provider in terms of the Financial Advisory and Intermediary Services Act 2002 (FSP No. 27231). Any analysis/data/opinion contained herein are for informational purposes only and should not be considered advice or a recommendation to invest in any security. The content herein was created using proprietary strategies based on parameters that may include price, time, economic events, liquidity, risk, and macro and cyclical analysis. Securities involve a degree of risk and are volatile instruments. Market and economic conditions are subject to sudden change, which may have a material impact on the outcome of financial instruments and may not be suitable for all investors. When trading or investing in securities or alternative products, the value of the product can increase or decrease meaning your investment can increase or decrease in value. Past performance is not an indication of future performance. Trive South Africa (Pty) Ltd, and its employees assume no liability for any loss or damage (direct, indirect, consequential, or inconsequential) that may be suffered from using or relying on the information contained herein. Please consider the risks involved before you trade or invest.