Being health conscious is a long-term thing, but when it comes to your portfolio, forget about an apple a day because energy drinks are where it’s been over the long haul.
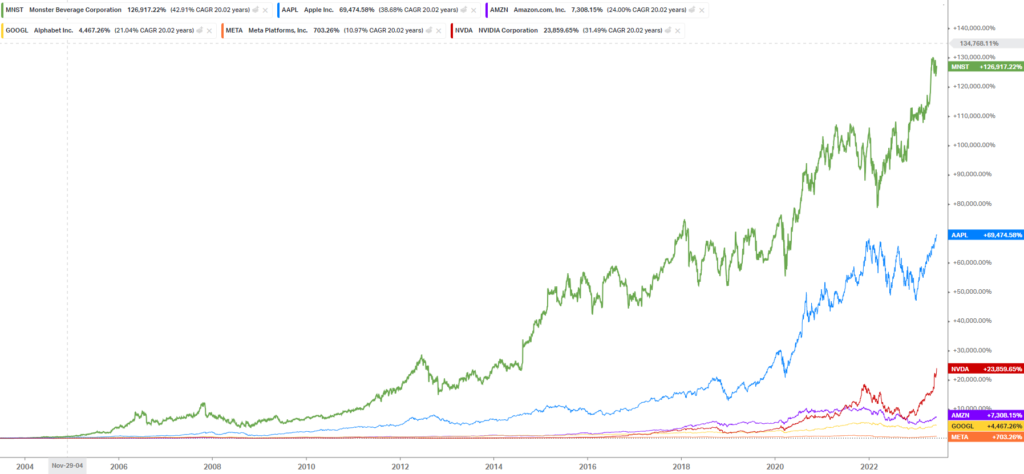
Monster Beverage Corporation (NASDAQ: MNST) has given going green a new meaning when looking at share price performance over the last two decades compared to the more tech-heavy Faang favourites like Apple, Amazon, Google, Meta and Nvidia.
When looking at the below chart, we can see Monster (green line) gained over 125 679% over 20 years, followed by Apple Inc’s 69 294% (blue line), Amazon Inc’s 7205% (purple line), Google’s 4829% (yellow line), Meta Platforms 608%(orange) and Nvidia 23 859% (red line).
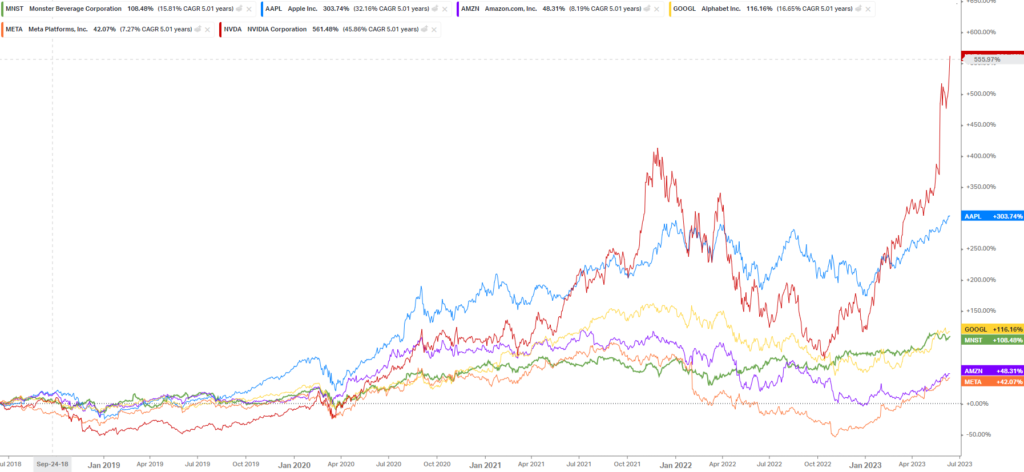
But if we fast forward to the present, we might see a different picture as tech staged a comeback this year despite the unfavourable macroeconomic environment compared to Monster.
The chart below shows a different picture over the last five years, with Monster holding its own against Google, Amazon and Meta. Still, the apparent dominance of Nvidia (red line) and Apple (blue line) occurred over this period.
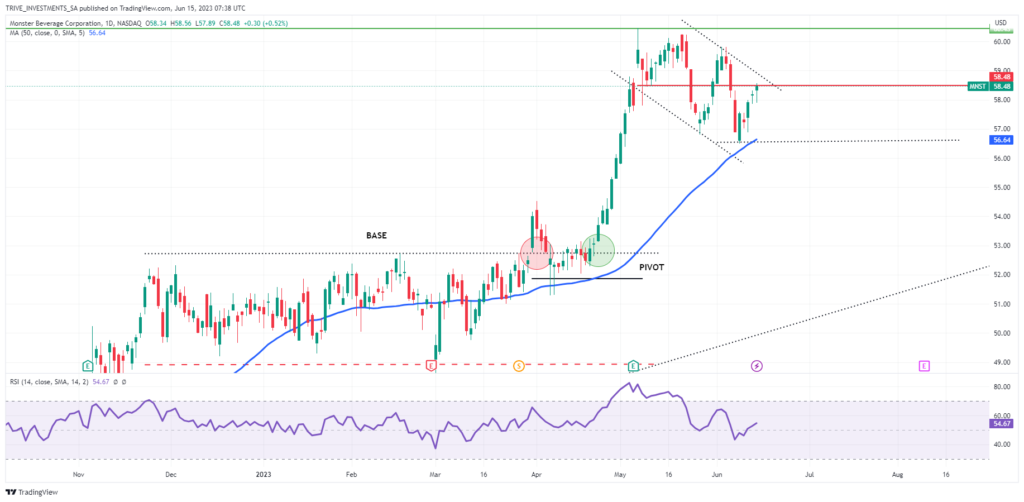
Technicals
Looking at the daily timeframe of Monster, we can see that the upward trend started with a base breakout (green circle) after the attempted fake-out (red circle). The price action has reached a significant overhead resistance of around $60.43 (green line), started to trend lower, and is forming a technical flag pattern.
Swing traders would need to see the price move above the $58.48 price level (red line) and break out of the descending flag for the possibility of seeing the price trend higher to the overhead resistance. If the price action continues within the descending pattern, then we could potentially see the price trend lower to the $56.64 (black dotted) support level, bringing the 50-day SMA (blue line) into focus.
Summary
A possible technical flag pattern is in progress which could bring the significant resistance level at $60.43 into focus for swing traders if the price action can break out and stay above $58.48. Lower levels of support are around $56.64 a share, bringing the 50-day Simple Moving average of price also into focus.
Sources: Monster Beverage Corporation, Koyfin, TradingView.
Disclaimer: Trive South Africa (Pty) Ltd, Registration number 2005/011130/07, and an Authorised Financial Services Provider in terms of the Financial Advisory and Intermediary Services Act 2002 (FSP No. 27231). Any analysis/data/opinion contained herein are for informational purposes only and should not be considered advice or a recommendation to invest in any security. The content herein was created using proprietary strategies based on parameters that may include price, time, economic events, liquidity, risk, and macro and cyclical analysis. Securities involve a degree of risk and are volatile instruments. Market and economic conditions are subject to sudden change, which may have a material impact on the outcome of financial instruments and may not be suitable for all investors. When trading or investing in securities or alternative products, the value of the product can increase or decrease meaning your investment can increase or decrease in value. Past performance is not an indication of future performance. Trive South Africa (Pty) Ltd, and its employees assume no liability for any loss or damage (direct, indirect, consequential, or inconsequential) that may be suffered from using or relying on the information contained herein. Please consider the risks involved before you trade or invest.