The Canadian dollar (CAD) continues its ascent against its US counterpart (USD), buoyed by a potent cocktail of improving economic optimism and fading hawkish sentiment from the Bank of Canada (BoC). Minutes from the latest BoC meeting revealed concerns about elevated shelter prices, potentially hindering their inflation target. However, recent statistics showcasing surging immigration and easing rate hike expectations have ignited hope for a resilient housing market, lifting Canadian spirits.
Global risk appetite swings towards optimism, nudging investors away from safe-haven assets like the USD. This shift, coupled with dovish Fed rhetoric, weakens the American greenback, further aiding the CAD’s climb.
Canadian government bond yields dip across the curve, mirroring US Treasuries. The 10-year yield hits a near six-month low, reflecting optimism around economic prospects and reducing pressure on the CAD.
Technical
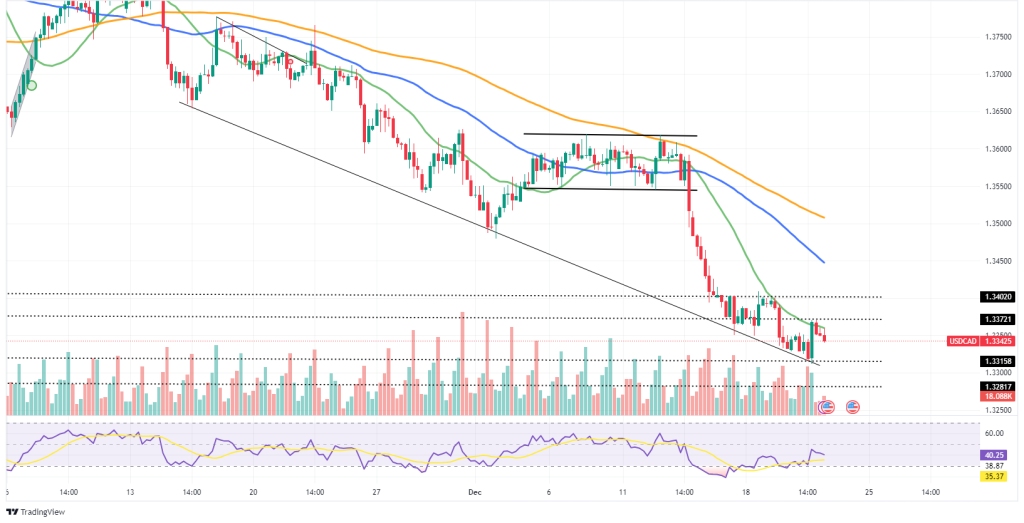
Currently, at 1.33425, USDCAD trades slightly lower for the session. The price action remains below the 20-SMA (green), 50-SMA (blue), and 100-SMA (orange). The downward-sloping 20-SMA is well below the 50-SMA and 100-SMA, suggesting a potential shift in momentum from bearish to bullish.
The flat RSI (40.25) and RSI-based MA (35.37) indicate neutral conditions with no clear directional bias.
Short-term trading opportunities could exist towards the resistance level at the 1.33721 price level should the bulls sustain a push above the 20-SMA. A break above the initial resistance could confirm the bullish momentum, likely bringing the resistance at 1.34020 into play.
However, short-term trading opportunities could arise towards the initial support at 1.33158 should the bears sustain a push lower. A break below the 1.33158 level would likely bring the 1.32817 support level into play in the short term.
Summary
USDCAD faces a pivotal moment as fundamental factors and technical indicators converge. Watch for potential shifts in sentiment based on economic data outcomes. A breach above 1.33721 could signal short-term bullish momentum, while a dip below 1.33158 may open the door for further downside potential.
Sources: TradingView, Reuters.
Piece written by Mfanafuthi Mhlongo, Trive Financial Market Analyst
Disclaimer: Trive South Africa (Pty) Ltd, Registration number 2005/011130/07, and an Authorised Financial Services Provider in terms of the Financial Advisory and Intermediary Services Act 2002 (FSP No. 27231). Any analysis/data/opinion contained herein are for informational purposes only and should not be considered advice or a recommendation to invest in any security. The content herein was created using proprietary strategies based on parameters that may include price, time, economic events, liquidity, risk, and macro and cyclical analysis. Securities involve a degree of risk and are volatile instruments. Market and economic conditions are subject to sudden change, which may have a material impact on the outcome of financial instruments and may not be suitable for all investors. When trading or investing in securities or alternative products, the value of the product can increase or decrease meaning your investment can increase or decrease in value. Past performance is not an indication of future performance. Trive South Africa (Pty) Ltd, and its employees assume no liability for any loss or damage (direct, indirect, consequential, or inconsequential) that may be suffered from using or relying on the information contained herein. Please consider the risks involved before you trade or invest.