The USDMXN pair showed signs of recovering after rising over 0.3% during the Thursday trading session as the pair looked to cap a two-day decline. The recent slump was heavily influenced by the disappointing US employment data. The Mexican peso’s ascent against the US dollar persisted amidst the Federal Reserve’s contemplation of substantial rate cuts, with expectations surpassing 100 basis points, driven by a cooling labour market and a decline in the Core PCE Index.
On the domestic front, Mexico’s consumer confidence surged to 47.3, reaching its highest level since February 2019, indicating positive sentiment and possibly enabling the Bank of Mexico to maintain its restrictive monetary policy. Differing opinions within Banxico officials, with hints at potential rate cuts by Governor Victoria Rodriguez Ceja in Q1 2024 countered by Deputy Governor Jonathan Heath’s opposition, have added to market uncertainty.
Technical Analysis:
The USDMXN currently hovers at 17.33834, edging closer to an ascending triangle’s upper boundary, indicating potential bullish sentiment. The recent bounce off the 50-SMA (blue line) and 100-SMA (orange line) signals positive momentum, and the upward-sloping 20-SMA (green line) breaking above both SMAs also acts to support the short-term bullish trend. The RSI at 52.42 and RSI-based MA at 53.14 suggest moderate strength.
Short-term trading opportunities may emerge towards the 17.38914 resistance level if bulls sustain a push above the 20-SMA, potentially targeting the 17.47946 and 17.56428 resistance levels higher. Conversely, a push lower might find support at 17.26071, with a break leading to 17.19399 and 17.11726.
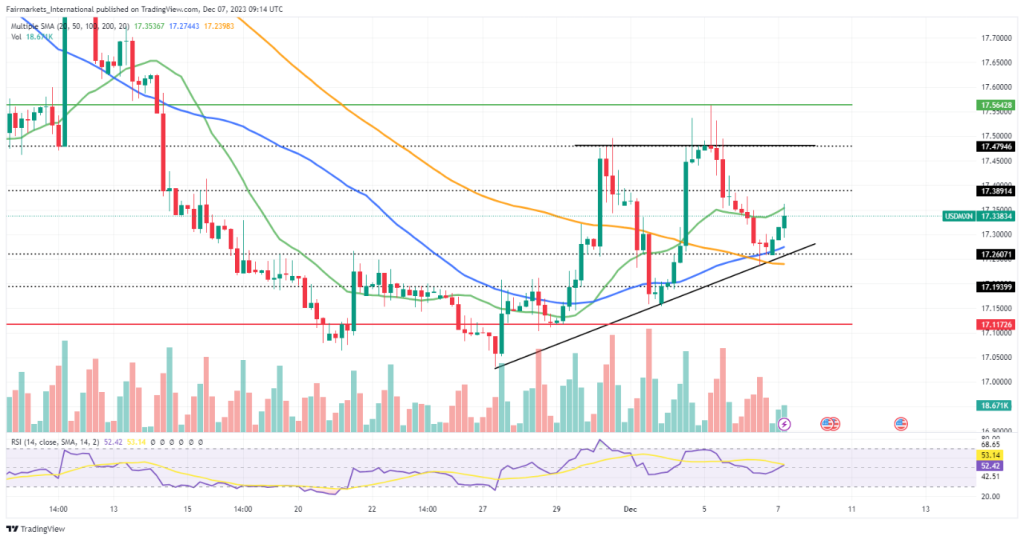
Summary:
The USDMXN pair remains influenced by fundamental factors, especially the Federal Reserve’s rate cut expectations and Mexico’s robust Consumer Confidence, ahead of Friday’s highly anticipated NFP report.
Technical analysis signals a potential bullish bias if the pair sustains its momentum above the 20-SMA, with the 17.38914 and 17.47946 resistance levels likely to act as levels of significance. However, failure could lead to short-term bearish movements towards the 17.26071 support level, with the 17.19399 support acting as the next level of interest.
Sources: TradingView, Trading Economics, Reuters, Dow Jones Newswire.
Piece written by Mfanafuthi Mhlongo, Trive Financial Market Analyst
Disclaimer: Trive South Africa (Pty) Ltd, Registration number 2005/011130/07, and an Authorised Financial Services Provider in terms of the Financial Advisory and Intermediary Services Act 2002 (FSP No. 27231). Any analysis/data/opinion contained herein are for informational purposes only and should not be considered advice or a recommendation to invest in any security. The content herein was created using proprietary strategies based on parameters that may include price, time, economic events, liquidity, risk, and macro and cyclical analysis. Securities involve a degree of risk and are volatile instruments. Market and economic conditions are subject to sudden change, which may have a material impact on the outcome of financial instruments and may not be suitable for all investors. When trading or investing in securities or alternative products, the value of the product can increase or decrease meaning your investment can increase or decrease in value. Past performance is not an indication of future performance. Trive South Africa (Pty) Ltd, and its employees assume no liability for any loss or damage (direct, indirect, consequential, or inconsequential) that may be suffered from using or relying on the information contained herein. Please consider the risks involved before you trade or invest.