
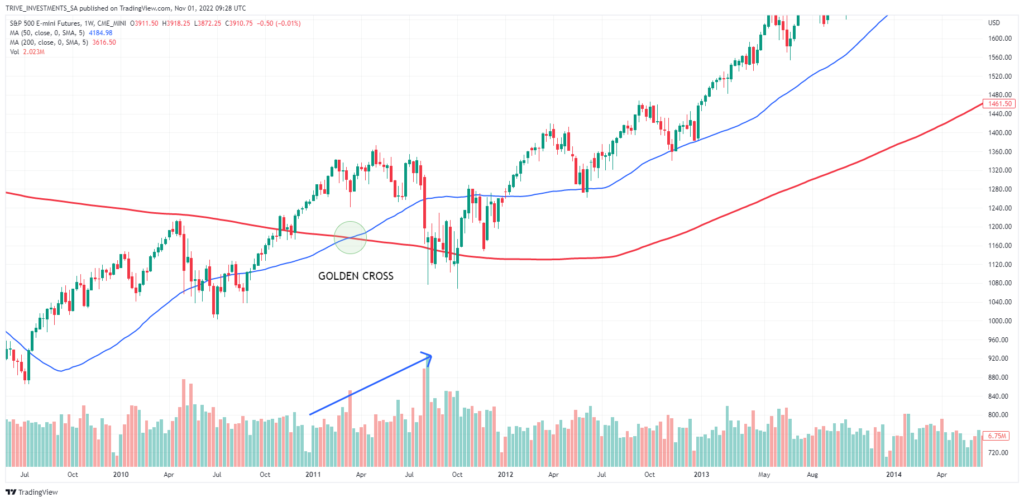
What is a Golden Cross?
The golden cross is visible when the 50-day simple moving average (SMA) crosses over a major long-term 200-day simple moving average (SMA) to the upside. The Golden Cross is interpreted as the harbinger of a possible long-term bull market in which prices rise with great momentum well past previous peaks in the charts.
What is a Death Cross?
The bearish death cross occurs when the 50-day simple moving average (SMA) crosses over a major long-term 200-day simple moving average (SMA) to the downside. A death cross can be interpreted as the start of a possible long-term bear market, where prices enter a falling trend and the lows in the charts can continue to go down.
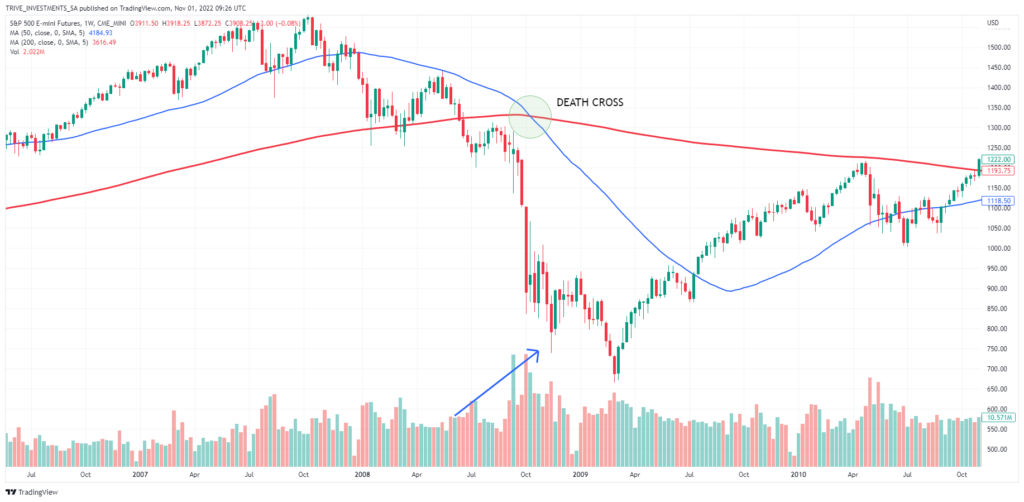
Take note: An important parameter of the golden cross or death cross is the trading volume on the exchanges which increased significantly. For both, a high trading volume in the buy or sell direction is considered a more meaningful signal for technical analysts. On the flip side, if the trading volume is low, the analysis is considered less reliable.