
Discovery Ltd (JSE: DSY) has captured market attention with its fluctuating share price, experiencing a downturn this year after a prosperous 2023.
Despite a solid performance last year, where it gained 16%, the share price is currently down nearly 6% year-to-date. In the 2023 financial year, Discovery Group showcased robust performance across its South Africa (SA), United Kingdom (UK), and Vitality Global (VG) segments, driving substantial growth in premiums and revenue.
Notably, total net income surged by 29% to R86,411 million, propelled by significant net fair value gains on financial assets and increased investment income. Operating profit and normalized headline earnings also witnessed notable increases, further bolstering investor confidence. The company’s attractive dividend policy, evidenced by a final gross cash dividend of R1.10 declared last year, garnered attention from dividend-seeking investors. As the market eagerly anticipates Discovery’s latest half-year earnings report, stakeholders await to see if the company will sustain its positive momentum.
Technical
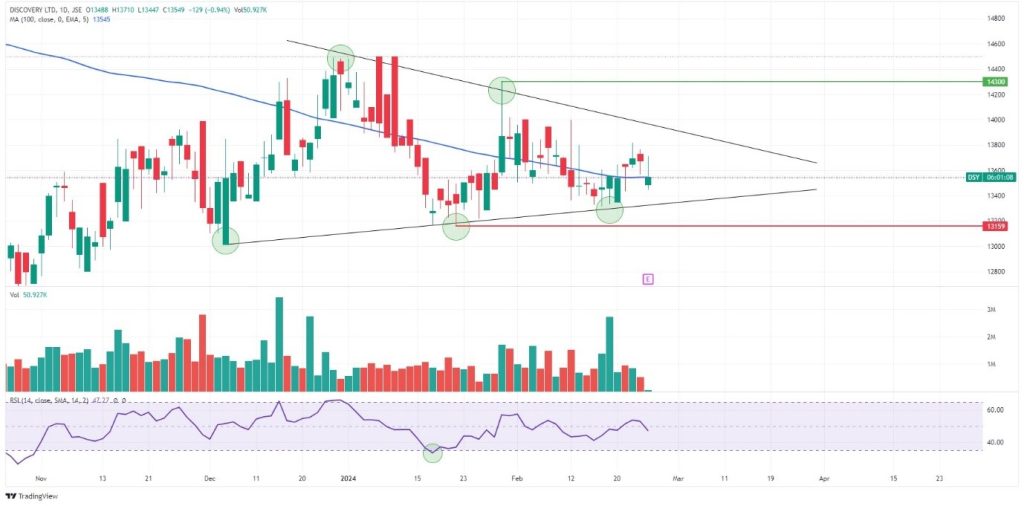
Discovery’s share price is currently exhibiting a symmetrical triangle pattern, indicating a period of consolidation characterized by converging highs and lows.
This pattern suggests a balance between bullish and bearish forces, with neither side exerting full control over price direction. Support at R131.59 per share, coupled with oversold RSI conditions, prompted a rally, yet upside momentum was capped at R143.00 per share, leading to a subsequent downturn.
The symmetrical triangle formation typically precedes a breakout, which could signal the end of consolidation and trigger an extended move in the breakout direction. Depending on whether the breakout occurs to the upside or downside, investors will look to key levels such as R143.00 or R131.59 per share for potential points of interest.
Summary
As Discovery Ltd anticipates its latest half-year earnings report, investors await to see if the company will uphold its robust performance of the previous financial year. With the share price exhibiting a symmetrical triangle pattern, potential breakouts with key levels like R131.59 or R143.00 per share could signal future market direction.
Sources: Discovery Ltd, Reuters, TradingView
Piece Written By Nkosilathi Dube, Trive Financial Market Analyst
Disclaimer: Trive South Africa (Pty) Ltd (hereinafter referred to as “Trive SA”), with registration number 2005/011130/07, is an authorised Financial Services Provider in terms of the Financial Advisory and Intermediary Services Act, 37 of 2002. Trive SA is authorised and regulated by the South African Financial Sector Conduct Authority (FSCA) and holds FSP number 27231. Trive Financial Services Ltd (hereinafter referred to as “Trive MU”) holds an Investment Dealer (Full-Service Dealer, excluding Underwriting) Licence with licence number GB21026295 pursuant to section 29 of the Securities Act 2005, Rule 4 of the Securities Rules 2007, and the Financial Services Rules 2008. Trive MU is authorized and regulated by the Mauritius Financial Services Commission (FSC) and holds Global Business Licence number GB21026295 under Section 72(6) of the Financial Services Act. Trive SA and Trive MU are collectively known and referred to as “Trive Africa”.
Market and economic conditions are subject to sudden change which may have a material impact on the outcome of financial instruments and may not be suitable for all investors. Trive Africa and its employees assume no liability for any loss or damage (direct, indirect, consequential, or inconsequential) that may be suffered. Please consider the risks involved before you trade or invest. All trades on the Trive Africa platform are subject to the legal terms and conditions to which you agree to be bound. Brand Logos are owned by the respective companies and not by Trive Africa. The use of a company’s brand logo does not represent an endorsement of Trive Africa by the company, nor an endorsement of the company by Trive Africa, nor does it necessarily imply any contractual relationship. Images are for illustrative purposes only and past performance is not necessarily an indication of future performance. No services are offered to stateless persons, persons under the age of 18 years, persons and/or residents of sanctioned countries or any other jurisdiction where the distribution of leveraged instruments is prohibited, and citizens of any state or country where it may be against the law of that country to trade with a South African and/or Mauritius based company and/or where the services are not made available by Trive Africa to hold an account with us. In any case, above all, it is your responsibility to avoid contravening any legislation in the country from where you are at the time.
CFDs and other margin products are complex instruments and come with a high risk of losing money rapidly due to leverage. You should consider whether you understand how these products work and whether you can afford to take the high risk of losing your money. Professional clients can lose more than they deposit. See our full Risk Disclosure and Terms of Business for further details. Some or all of the services and products are not offered to citizens or residents of certain jurisdictions where international sanctions or local regulatory requirements restrict or prohibit them.