The latest triumph from Clicks Group Limited (JSE: CLS) has sent optimistic waves of excitement through the market. Revealing their remarkable accomplishments for the year, concluding on August 31, 2023, the result was a 6% surge in share value on Thursday. As the reigning authority in South Africa’s health, wellness, and beauty sector, Clicks Group unveiled sturdy growth and an impressive expansion of their empire – now gracing the nation with over 880 stores and 710 pharmacies. The secret behind their triumph can be attributed to market dominance across all key product categories, a testament to their unwavering strength in the face of a challenging economic climate marked by frugal consumers and dwindling spending.
Apart from the pivotal contributions of COVID-19 vaccinations, the group celebrated an extraordinary 8.2% surge in their financial turnover, elevating their revenue to an astonishing R41.6 billion. This financial success rippled into an impressive 11.5% uptick in adjusted diluted headline earnings per share (HEPS), making a significant leap from 936.6 cents to 1,044.5 cents. However, the real star of the show was the remarkable R5.9 billion in cash that flowed in from their operational endeavours, laying the foundation for a sustainable 6.6% boost in dividends, now standing at 679 cents per share. The year’s story didn’t end there; in its generous spirit, the company returned a staggering R2.3 billion to its cherished shareholders, all while upholding a sturdy R2.5 billion in cash security on the balance sheet.
Technical
On the 1D chart, the earnings reaction defied the bearish cross of the 100-SMA (orange line) above the 50-SMA (blue line) as the 6.07% leap broke through the dynamic resistance of a descending channel. The 61.8% Fibonacci golden ratio is now threatened at R268.60, a potentially crucial level in the directional price action for the week’s closing session.
If the resistance at R268.80 prevents the current momentum from continuing, a retracement of the Thursday surge is possible, which could result in a pullback below the Fibonacci midpoint at R262.50. The breakout level at R254.68 could be the next focal point, where the share price could either return to its prior downtrend at R249.23 or pivot to continue the recent bullish momentum.
If the price moves above the R268.60 resistance in the Friday session, higher resistance at R276.36 could soon come into play. From this level, resistance at R282.00 could be the final hurdle for the share price to cross before potentially converging with its estimated fair value of R288.64, which offers a 7.8% potential upside from the current price.
Fundamental
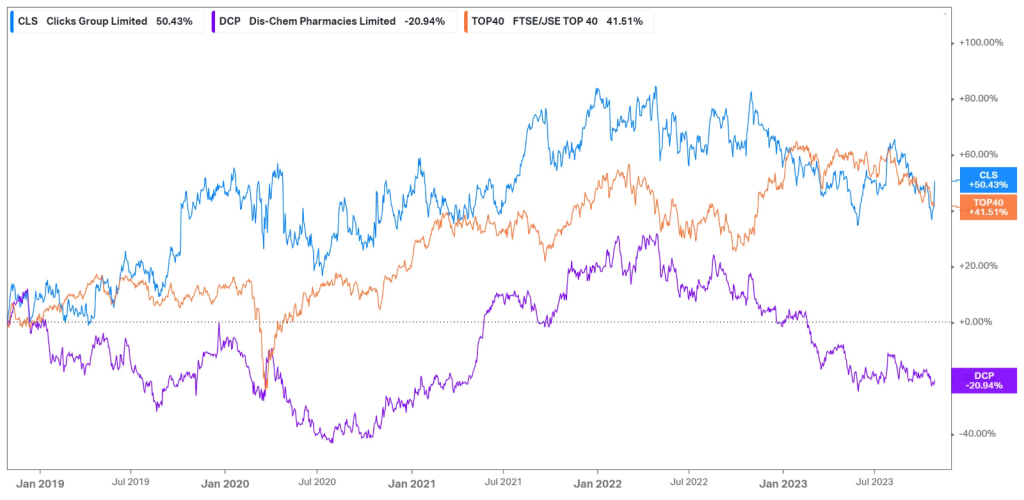
Over the past five years, Clicks has displayed resilient performance, with its price appreciating by over 50%. This price return has kept up the pace of the JSE Top 40 index, which has returned 42% over the same period, while its biggest competitor in Dis-Chem has fallen behind, contracting close to 21%. Due to Clicks’ tilt toward staple products, it has been able to weather the macroeconomic developments that have constrained the consumer’s budget over recent years. However, it has recently emerged into a downtrend, as retail costs edged higher, driven by higher transport costs, resulting from the rise in the oil price over the financial period, as well as diesel costs to operate its generators, which amounted to R53.8M in the period under question. With rising costs and dwindling consumer spending, the business environment is certainly a challenging one for the industry.
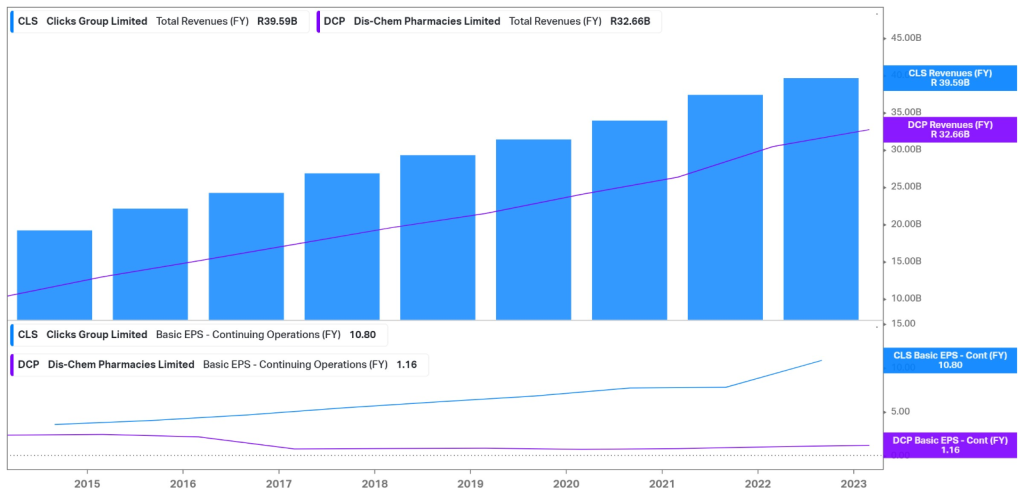
However, its top line remained robust, as shown in the graph below. Retail turnover was up 12.2%, reflecting strong growth in private labels and sustained recovery in the beauty category. Its loyalty program further underpinned its top line, as it now boasts 10.4M active members. The graph below shows the top line of Clicks compared to Dis-Chem, revealing a similar growth trajectory over the last ten years. However, a clear divergence emerges on the bottom line, suggesting more efficiency from Clicks in managing its operational expenditures.
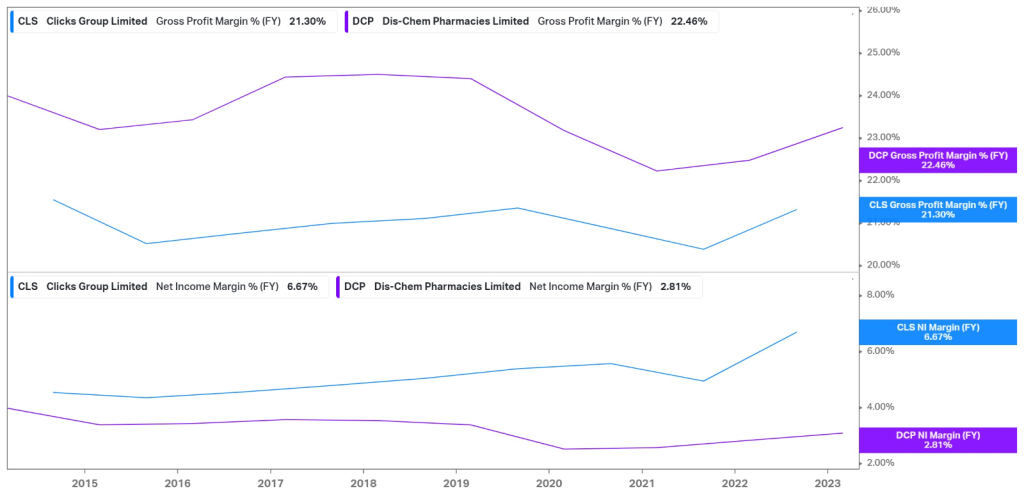
This is further highlighted in the analysis of the margins of the respective companies. While Dis-Chem posts a gross profit margin of 22.46% compared to the 21.3% of Clicks, the net income margin paints a different picture. Clicks have a net income margin of 6.67%, exceeding the 2.81% of Dis-Chem. The recent uptick in margins in the latest financial year resulted from resilient growth in its high-margin private-label products, while the low-margin vaccination business took a back seat.
After a stellar full-year report, Clicks reported expectations of a constrained trading environment in the new financial year. However, with its defensive business model, management remained confident in the group’s ability to deliver on its medium-term targets. Clicks plans to open 40-50 new stores and another 40-50 pharmacies for the upcoming year, showcasing its commitment to the longer-term target of 1200 stores. Additionally, the company plans to spend R880M in capital investment for the forthcoming year, including an R393M investment to improve its supply chain, technology, and infrastructure. This could set it up for another profitable year of growth as we advance.
Summary
After a profitable quarter, Clicks Group Limited acknowledged the potential of a constrained operating environment in the upcoming year but reiterated the confidence in its ability to meet its operational targets. As they continue to show resilience in the face of adversity, the company presents a 7.8% potential upside from current levels to its estimated fair value of R288.64.
Sources: Koyfin, Tradingview, Clicks Group Limited
Piece written by Tiaan van Aswegen, Trive Financial Market Analyst
Disclaimer: Trive South Africa (Pty) Ltd, Registration number 2005/011130/07, and an Authorised Financial Services Provider in terms of the Financial Advisory and Intermediary Services Act 2002 (FSP No. 27231). Any analysis/data/opinion contained herein are for informational purposes only and should not be considered advice or a recommendation to invest in any security. The content herein was created using proprietary strategies based on parameters that may include price, time, economic events, liquidity, risk, and macro and cyclical analysis. Securities involve a degree of risk and are volatile instruments. Market and economic conditions are subject to sudden change, which may have a material impact on the outcome of financial instruments and may not be suitable for all investors. When trading or investing in securities or alternative products, the value of the product can increase or decrease meaning your investment can increase or decrease in value. Past performance is not an indication of future performance. Trive South Africa (Pty) Ltd, and its employees assume no liability for any loss or damage (direct, indirect, consequential, or inconsequential) that may be suffered from using or relying on the information contained herein. Please consider the risks involved before you trade or invest.