In the wake of the fundamental shift in the oil market dynamics, the iShares Global Energy ETF (NYSE Arca: IXC) has been on the rise, catching investor attention due to its promising runway ahead. This dynamic ETF, having recently reached a remarkable 52-week high, is harnessing the immense potential of surging energy markets. As oil prices steadily climb in response to the ongoing supply constraints imposed by OPEC +, this fund has harnessed this energy frenzy to ignite substantial momentum. A spectacular 31% surge from its lows just one year ago is a testament to its robust performance.
This ETF provides exposure to global equities in the energy sector, holding 52 securities in growth and value stocks of large-cap energy companies. Seeking to track the performance of its benchmark, the S&P Global 1200 Energy 4.5/22.5/45 Capped Index, it provides investors with diversified exposure to the energy sector, primarily the oil and gas markets.
Technical
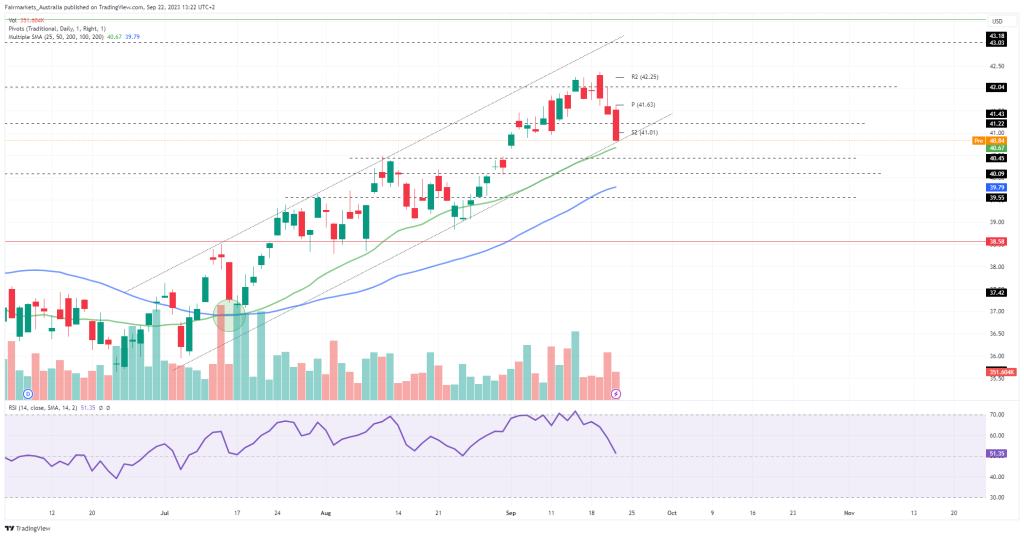
On the 1D chart, an ascending channel has formed, with the crossing of the 25-SMA (green line) above the 50-SMA (blue line) underpinning the bullish momentum. However, with the recent hawkish tone in the Federal Reserve’s commentary, the price has broken down the daily pivot point at $41.63 and is now pressuring the dynamic support of the channel at $41.01 (S2).
With the 25-SMA providing additional support at this pivotal level, it could prove a challenging barrier for the bears to pass. A pivot off this support could trigger the continuation of the uptrend toward $42.02 and $42.25 (R2) as the fundamentals still favour the upside in the oil price. In the longer term, higher resistance is established at $43.03 and $43.55.
However, if the dynamic support gets broken down, support at $40.45 and $40.09 could come into play. To confirm the sustainability of the break, the price may have to clear $39.55, pushing it below the 50-SMA, at which point the neckline support at $38.58 may come into play.
Fundamental
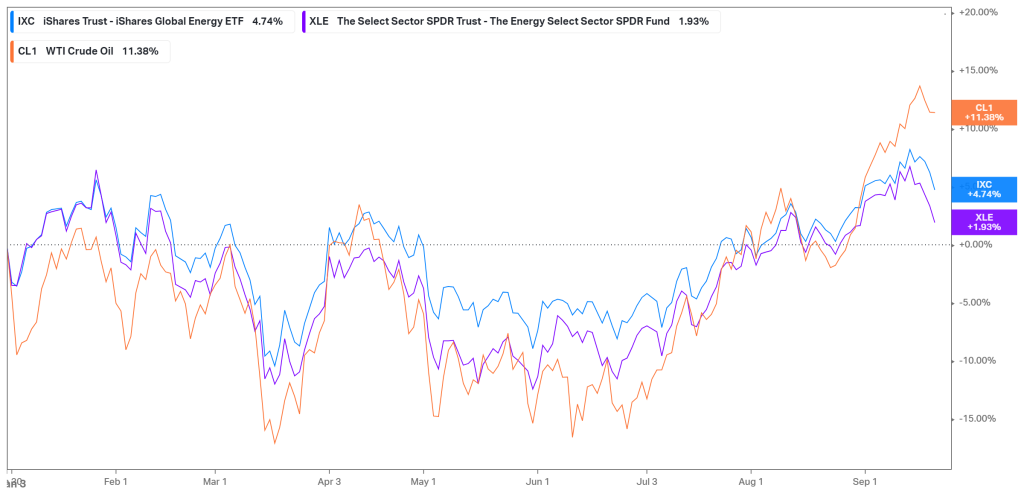
Year to date, the IXC ETF has only returned 4.74%, with a lot of volatility inherent in its price moves. This could be explained by the continuous changes in the oil price, which is demonstrated below. With the demand environment under pressure due to the high interest rate and strong US dollar, the oil price was mostly under pressure in the early months of the year. However, since then, there has been a fruitful recovery, as the tightening supply aids an improving demand environment, causing OPEC to forecast a large oil supply deficit in the second half of the year. These improving conditions have triggered a surge in the oil price, adding the upside to energy companies with large exposure to oil. Over the last three months, the ETF has appreciated 12.32%, as it is now riding its bullish momentum.
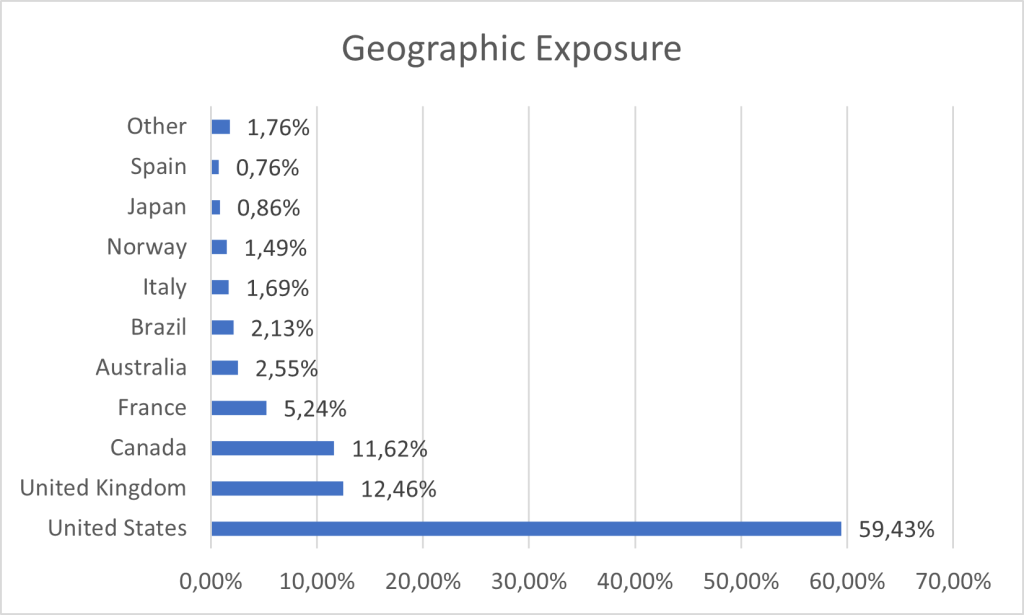
While this ETF is a global fund, it is mainly concentrated in the US, with Northern America, including Canada, accounting for over 70% of the fund’s exposure. An additional 12.46% exposure to the UK makes the fund heavily concentrated within these geographies. Apart from France, which attributes 5.24% to the fund’s allocation, no other geography holds more than a 3% weighting.
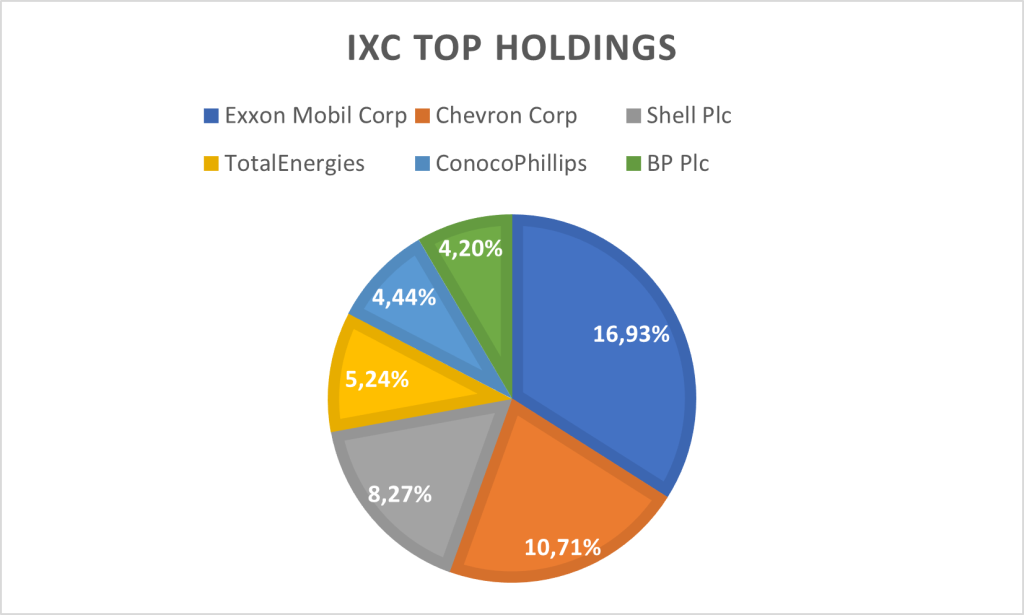
The geographic exposure becomes evident when looking at the underlying holdings. Exxon Mobil holds a 16.93% weighting, with Chevron holding 10.71%, which accounts for its biggest US holdings. In the UK, Shell represents the geography’s biggest holding at 8.27%, while Total Energies accounts for almost all of France’s exposure at 5.24%. Within these companies, 55.84% of the sector exposure falls within integrated oil and gas, with another 21.6% coming from oil and gas exploration and production.
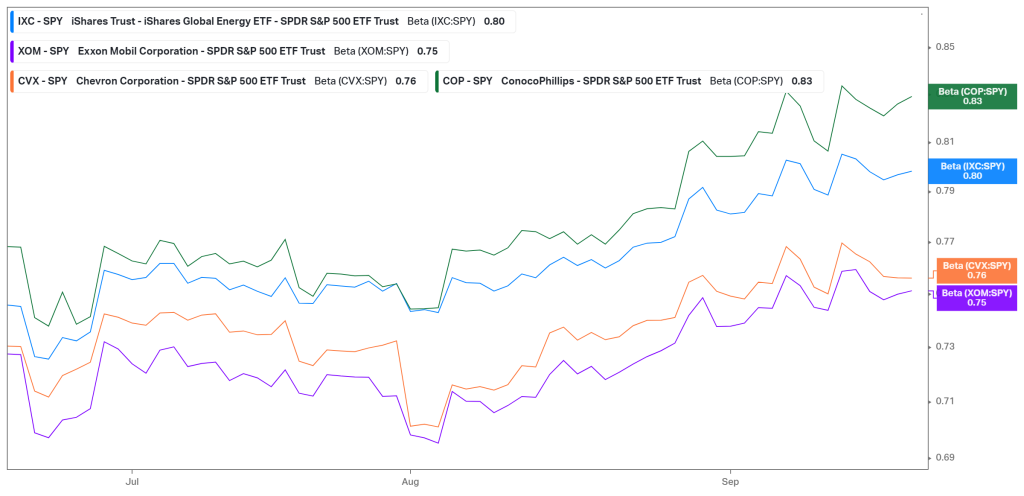
The fund operates with a beta of 0.87 against the S&P 500, with a 31.87% standard deviation over three years. However, when analyzing the respective betas of the underlying securities, it becomes evident that the fund has a higher beta exposure than its largest holdings. Exxon and Chevron operate with a beta of 0.75 and 0.76, respectively, suggesting that the fund’s higher beta exposure comes from its smaller holdings. Therefore, its smaller holdings hold more risk regarding volatility in its price moves, which could boost the fund’s upside potential. At the same time, the lower betas of its top holdings could provide some insulation during more challenging market times by reducing the fund’s volatility.
Summary
With the recent surge in the oil price, the iShares Global Energy ETF has been riding the momentum in the energy market, returning 12.32% over the last three months. While hawkish comments from the Federal Reserve have clouded the demand forecasts for the rest of the year, the tightening supplies could continue to provide tailwinds for energy companies. If the dynamic support of the ascending channel at $41.01 holds firm, the solid upside could continue toward $43.03 and $43.55 in upcoming sessions.
Sources: Koyfin, Tradingview, iShares.com
Piece written by Tiaan van Aswegen, Trive Financial Market Analyst
Disclaimer: Trive South Africa (Pty) Ltd, Registration number 2005/011130/07, and an Authorised Financial Services Provider in terms of the Financial Advisory and Intermediary Services Act 2002 (FSP No. 27231). Any analysis/data/opinion contained herein are for informational purposes only and should not be considered advice or a recommendation to invest in any security. The content herein was created using proprietary strategies based on parameters that may include price, time, economic events, liquidity, risk, and macro and cyclical analysis. Securities involve a degree of risk and are volatile instruments. Market and economic conditions are subject to sudden change, which may have a material impact on the outcome of financial instruments and may not be suitable for all investors. When trading or investing in securities or alternative products, the value of the product can increase or decrease meaning your investment can increase or decrease in value. Past performance is not an indication of future performance. Trive South Africa (Pty) Ltd, and its employees assume no liability for any loss or damage (direct, indirect, consequential, or inconsequential) that may be suffered from using or relying on the information contained herein. Please consider the risks involved before you trade or invest.