The Fibonacci sequence, developed by Leonardo Fibonacci, is a steadily increasing series where each number equals the sum of the preceding two numbers. These numbers make up the Fibonacci sequence: 0, 1, 1, 2, 3, 5, 8, 13, 21, 34, 55, 89, 144 etc.
The Fibonacci sequence can be applied to various aspects of our lives. We can find the Golden Ratio in flowers, fruit, shells, architecture, music and within our DNA. Most importantly, we can apply it to our technical analyses.
The following equation denotes the Fibonacci sequence:
xn = xn – 1 + xn – 2
where xn is the term “n”
xn-1 is the previous term (n−1)
xn-2 is the term before that (n−2)
The Golden Ratio, also known as the divine proportion, is derived from the Fibonacci series by dividing each successive pair of Fibonacci numbers. This approximates 1.618 or its inverse 0.618.
The following equation denotes the Golden Ratio:
F(n)/(F(n-1))=1.618
where F(n) is the nth Fibonacci number
F(n-1) is the previous Fibonacci number
Many things in nature adhere to the ratio of 1.618, like the honeybee. If you divide the number of females in a colony by the number of males, you will get a number close to 1.618. The golden ratio also applies to faces as the proportion between our mouths and noses, and our eyes and the bottom of our chins equals the golden ratio. It is said that the closer our proportions adhere to 1.618, the more attractive we are.
The following three examples use the Fibonacci sequence to predict price movement. There are many more examples, but these seem to be used by most traders.
Fibonacci Retracement:
A Fibonacci retracement is known as a predictive indicator because it attempts to identify future price levels. This seems to work best when the market is either in an uptrend or a downtrend.
In order to find Fibonacci retracement levels, Swing Highs and Swing Lows need to be identified. For uptrends, you would draw from the Swing Low to the most recent Swing High and for downtrends, you would draw from the Swing High to the most recent Swing Low.
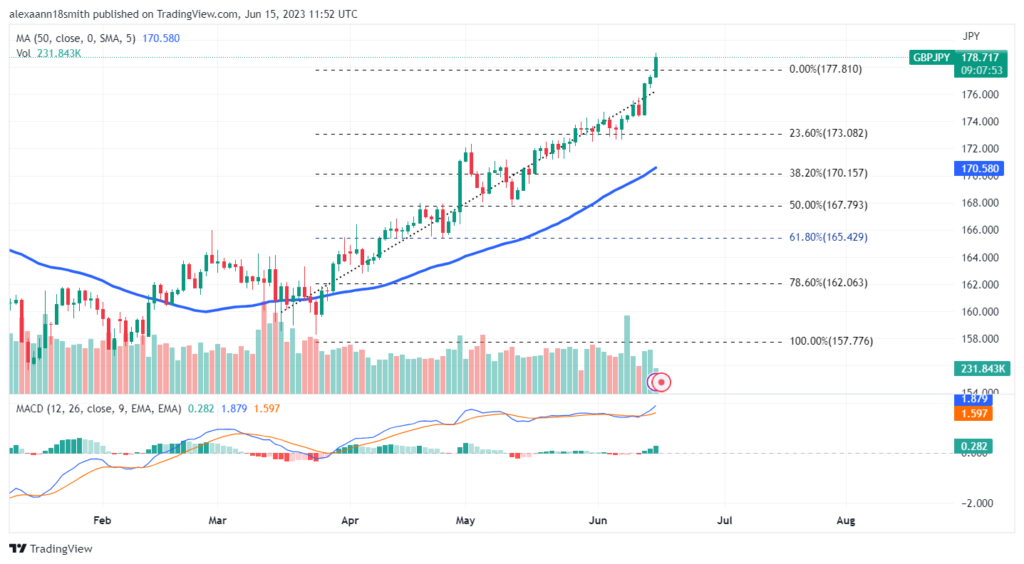
In theory, traders expect the price to retrace to a previous price level before resuming an upward or downward trend. The following chart exhibits the GBPJPY currency pair, which seems to be a good example of this, seeing as the pair pulled back to the 50% level before resuming its upward trend and now challenges higher levels of resistance.
*It may be important to note that the 50% level is not a Fibonacci level, but traders like to include it as it marks the halfway mark between the Swing High and the Swing Low*.
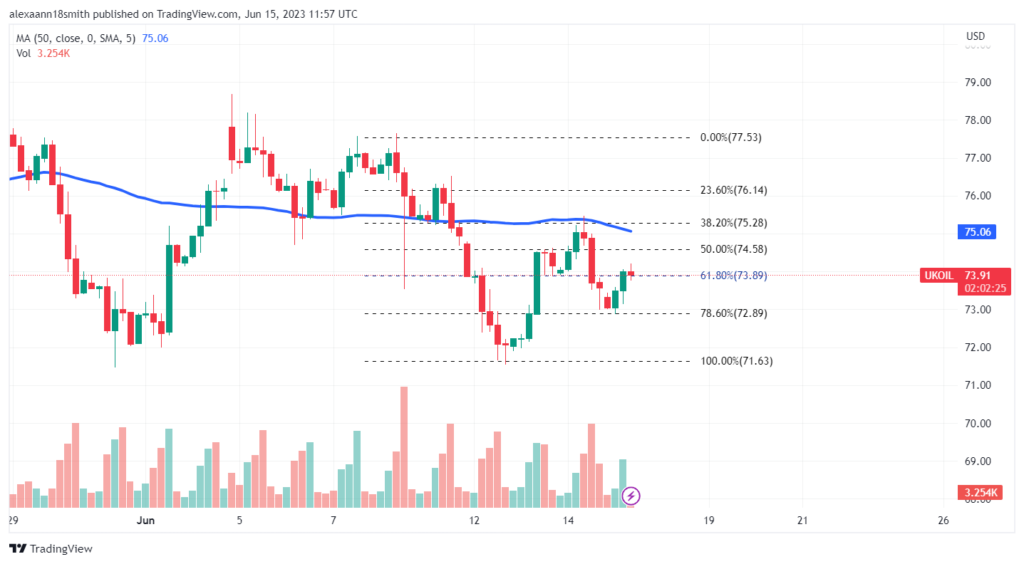
The same can be applied to Brent Crude Oil Futures in the following chart. The price level found support at $71.63 per barrel and then gained upward momentum towards the 38.20% Fibonacci Level before finding support again at the 78.60% Fibonacci level. The price level could continue to retrace to lower levels of support, or upward momentum could drive the price level towards the Golden Ratio.
Fibonacci Extension:
While Fibonacci retracements examine current price action, Fibonacci extensions establish target price levels following a breakout from trend highs or lows. Fibonacci extensions are drawn by clicking on a Swing Low, extending the trend line to the Swing High and then extending the trend line back down to any retracement level.
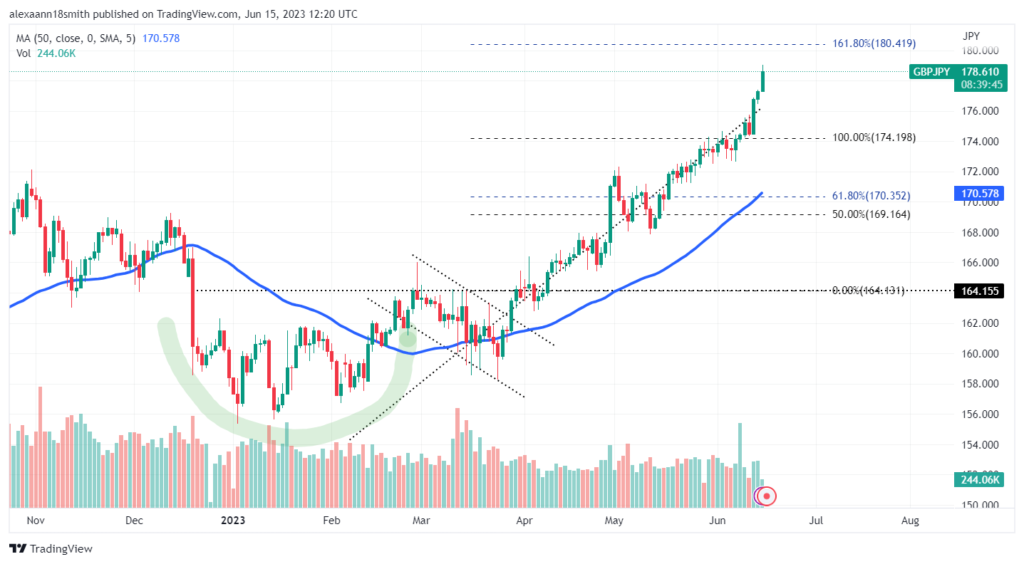
Looking at the GBPJPY currency pair again, a cup and handle pattern was formed which led to the formation of the base at 164.155. The price level then broke out towards multiple Fibonacci levels; however, the last pullback towards 174.198 saw the price level surge, which is where the Fibonacci Extension may become relevant as the currency pair could edge towards the higher Golden Ratio of 180.419 as it has surpassed the 174.198 price level.
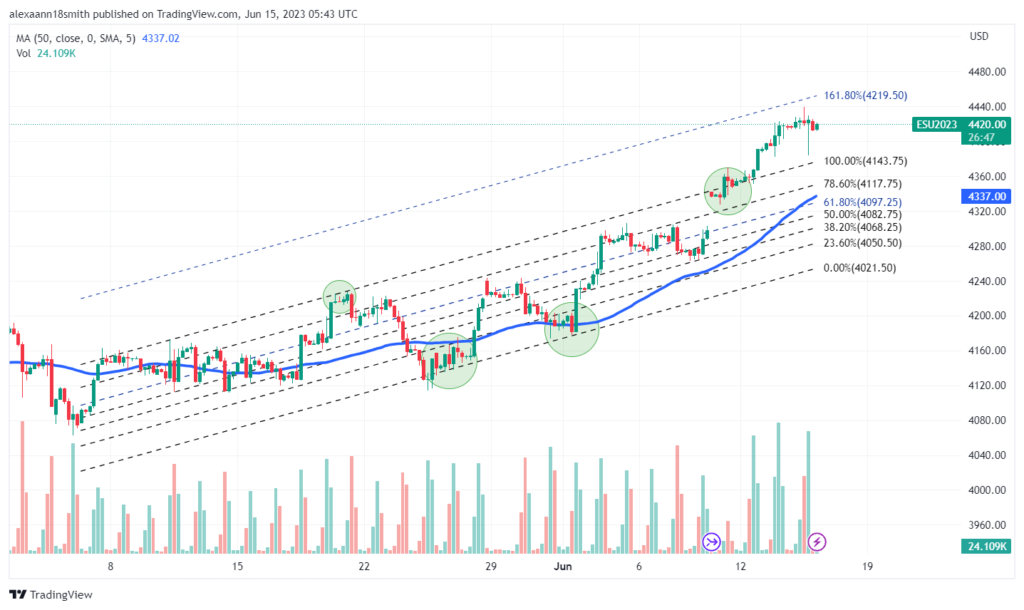
Fibonacci Channel:
The Fibonacci channel works similarly to the Fibonacci retracement, except that it is drawn within a channel pattern. The following chart is an example of the Fibonacci channel plotted within an ascending channel pattern seen on the chart of the S&P 500 Futures (CME: ES). The futures were drawn back to the 38.20% Fibonacci retracement before they surged, surpassed the 4143.75 resistance, and edged towards the Golden Ratio extension. Now, it looks like the futures may retrace where the possibilities seem endless.
Summary
The Fibonacci sequence is a great tool for observing price movement, but it should be used in conjunction with trends, moving averages, support and resistance and other indicators. After all, traders could use all the tools available to them to predict where the market is heading, but trader sentiment could see the market rally in the opposite direction.
Sources: TradingView, Fibonacci, Investopedia, Mathnasium
Disclaimer: Trive South Africa (Pty) Ltd, Registration number 2005/011130/07, and an Authorised Financial Services Provider in terms of the Financial Advisory and Intermediary Services Act 2002 (FSP No. 27231). Any analysis/data/opinion contained herein are for informational purposes only and should not be considered advice or a recommendation to invest in any security. The content herein was created using proprietary strategies based on parameters that may include price, time, economic events, liquidity, risk, and macro and cyclical analysis. Securities involve a degree of risk and are volatile instruments. Market and economic conditions are subject to sudden change which may have a material impact on the outcome of financial instruments and may not be suitable for all investors. When trading or investing in securities or alternative products, the value of the product can increase or decrease meaning your investment can increase or decrease in value. Past performance is not an indication of future performance. Trive South Africa (Pty) Ltd, and its employees assume no liability for any loss or damage (direct, indirect, consequential, or inconsequential) that may be suffered from using or relying on the information contained herein. Please consider the risks involved before you trade or invest.