The Cup and Handle pattern is a distinctive technical indicator, characterised by a formation that resembles a teacup with a handle. In this pattern, the “cup” takes on the shape of a “u,” while the “handle” exhibits a slight downward trend.
This pattern comprises two discernible components:
- The Cup: The first part emerges following a preceding downtrend and is succeeded by an uptrend, resulting in a configuration reminiscent of a bowl.
- The Handle: As the Cup formation draws to a close, the price action tends to consolidate on the right-hand side, giving rise to the Handle segment of the pattern.
Characteristics:
- Length: Patterns with more extended and “U”-shaped cups tend to provide stronger signals, while patterns with sharp “V”-shaped bottoms provide weaker signals.
- Depth: The depth of the Cup and handle should ideally not be excessive as an excessively deep Cup and Handle may infer a bearish trend.
The Cup and Handle stands as a distinctive herald of bullish momentum and serves as a tool for identifying potential buying opportunities in financial markets, signifying a period of consolidation leading to an anticipated breakout. Since the Cup and Handle attempts to retest previous high levels, investors who had previously bought at these levels introduce selling pressure. As a result, the price tends to consolidate and may experience a downward drift before resuming an uptrend. The subsequent breakout from the Handle’s trading range signals a resumption of the prior upward trajectory, carrying the potential for an extended bullish run.
Trading the Cup and Handle Chart Pattern:
- Cup Characteristics: The ideal scenario features identical highs on both sides of the Cup, but real-world scenarios often deviate from perfection.
- Handle Formation: Following the formation of the high on the right side of the Cup, a pullback ensues to give rise to the Handle. The Handle is essentially a period of consolidation that precedes the breakout.
- Handle Size: A crucial aspect is the Handle’s size relative to the Cup. The ideal scenario is that the handle should be smaller than the Cup itself. The Handle should not encroach into the lower half of the Cup; instead, it should ideally remain in the upper third.
- Breakout and Entry Point: To confirm the success of the Cup and Handle pattern, the price should break out or move upward beyond the point of prior resistance. Caution is advised when dealing with considerable slippage and the potential for false breakouts when implementing an assertive entry strategy.
- Increased Volume: This breakout should be accompanied by a notable surge in trading volume, further bolstering the pattern’s credibility.
- Price Target: Post-breakout, the price target can be estimated by measuring the distance between the breakout level of the Handle and the Cup’s bottom, subsequently adding this value to the breakout point.
Example of Cup and Handle:
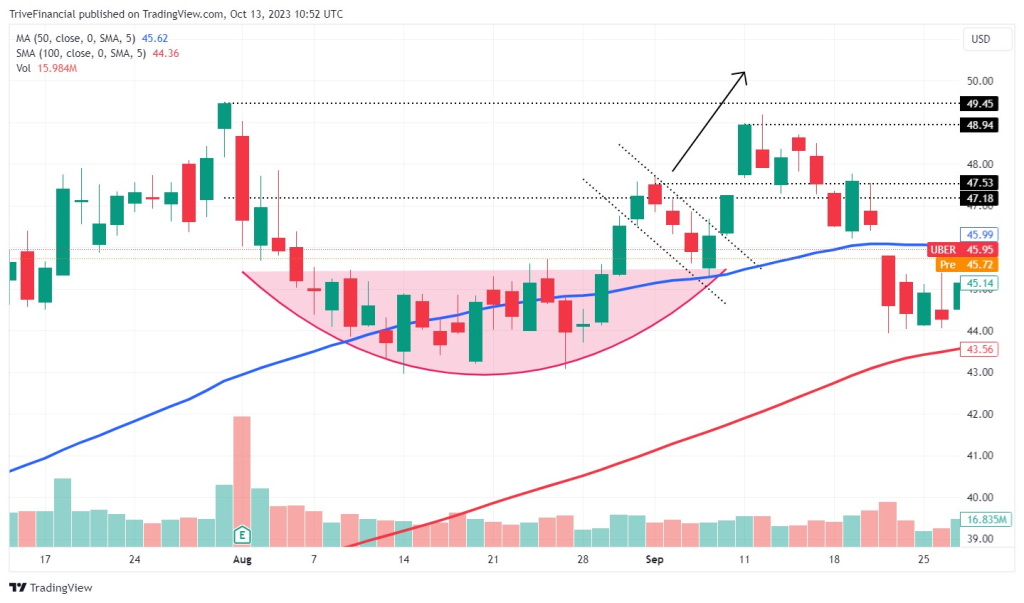
An example using the stock price of Uber Technologies on the 13th of October 2023 (NYSE: UBER) illustrates the Cup and Handle pattern. After rising to $49.45 per share, Uber experienced a significant decline. Subsequently, the stock initiated a recovery that established resistance at the $47.53 per share level. The pattern exhibited a classic pullback and then fell short of the previous high.
Limitations of the Cup and Handle Pattern:
While the Cup and Handle pattern is a valuable technical tool, it should be used in conjunction with other fundamental and technical indicators to make informed investment decisions. Several limitations are associated with this pattern. One challenge is the time required for the pattern to fully develop, potentially leading to delayed decisions. The formation of a Cup and Handle pattern can take as little as one month or as long as a year or more, making it ambiguous in some instances.
Another limitation pertains to the depth of the Cup; a shallower cup can be a signal in some cases, while a deeper cup can produce a false signal. There are instances where the Cup forms without the characteristic Handle, adding to the complexity. Lastly, like many technical patterns, the reliability of the Cup and Handle can be compromised in illiquid stocks.
Summary
The Cup and Handle pattern, a distinctive technical indicator resembling a teacup with a handle, consists of two components: the Cup, which follows a downtrend and resembles a bowl, and the Handle, a consolidation phase. Trading this pattern involves considering various aspects, such as the Cup’s length and depth, the Handle’s size, breakout strategies, increased volume, and price targets. However, it comes with limitations, including the time required for its formation, variations in cup depth, occasional absence of the Handle, and reduced reliability in illiquid stocks. It should, therefore, be used in conjunction with other technical and fundamental indicators in order to make well-informed decisions.
Sources: Investopedia, IBD, TradingView
Piece written by Alexa Smith, Trive Market Analyst
Disclaimer: Trive South Africa (Pty) Ltd, Registration number 2005/011130/07, and an Authorised Financial Services Provider in terms of the Financial Advisory and Intermediary Services Act 2002 (FSP No. 27231). Any analysis/data/opinion contained herein are for informational purposes only and should not be considered advice or a recommendation to invest in any security. The content herein was created using proprietary strategies based on parameters that may include price, time, economic events, liquidity, risk, and macro and cyclical analysis. Securities involve a degree of risk and are volatile instruments. Market and economic conditions are subject to sudden change, which may have a material impact on the outcome of financial instruments and may not be suitable for all investors. When trading or investing in securities or alternative products, the value of the product can increase or decrease meaning your investment can increase or decrease in value. Past performance is not an indication of future performance. Trive South Africa (Pty) Ltd, and its employees assume no liability for any loss or damage (direct, indirect, consequential, or inconsequential) that may be suffered from using or relying on the information contained herein. Please consider the risks involved before you trade or invest.