Harmony Gold Mining Company Limited (JSE: HAR) concluded 2023 with a positive operational update for the three months ending on the 30th of September, setting an optimistic tone for the initial quarter of its 2024 fiscal year. This report spurred a surge in the company’s stock price, contributing to the ongoing positive trend that has witnessed a remarkable 62% increase since January of the previous year.
However, the onset of 2024 hasn’t mirrored the upbeat conclusion of the preceding year, with the share price experiencing a modest dip of over 6% in the first two weeks. In addition, the Mponeng mine area has been temporarily closed as investigations are underway for a loss of life incident that occurred on the 4th of January. Now, as the company gears up to unveil its half-year earnings by the end of February, the question looms: will the optimistic momentum from last year persist, or is the market anticipating a more restrained outlook as the company discloses its next set of financials?
Technical
On the daily chart, an ascending channel pattern has been in play since early October, when the company’s price embarked on a sustainable uptrend. However, a double top formation became evident in recent weeks, and the dynamic support of the channel subsequently broke down. As things stand, a potential break and retest play could result in the formation of a new downtrend in the days to come.
If the price fails to exceed the 25-SMA (green line) at R112.83, the initial breakout could be sustained, with the 50-SMA (blue line) at R107.54 presenting the first barrier to the bearish trend. Any movement below this level could trigger a longer downtrend toward R103.00 and R97.07. The Fibonacci midpoint and golden ratio at R93.71 and R87.32, respectively, could then become levels of interest to catalyse a potential reversal.
However, if the price breaks above the 25-SMA resistance, the market could wipe out the recent losses from the downturn. Resistance at R114.19 could be a pivot point, as a breakout at this level holds the potential to open a pathway to further expansion within the original channel toward R120.46, the psychological resistance that triggered the current reversal. If the bulls manage to exceed this level on the third attempt, the price could maintain its momentum toward higher resistance at R126.55.

Fundamental
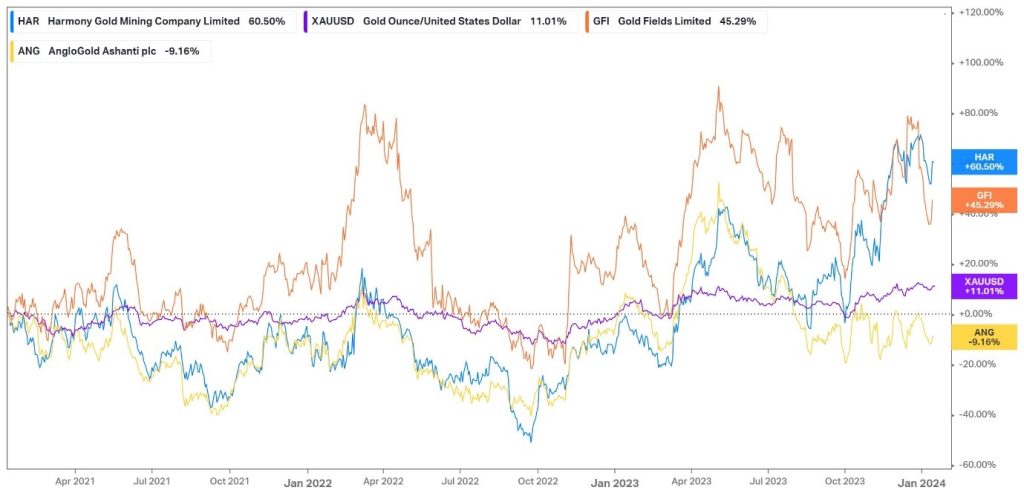
The graph below shows Harmony’s dominance in the domestic gold market over the last three years. In a period where the gold spot price (XAUUSD) appreciated by 11%, Harmony realised a 60.5% price return, outperforming its competitors in Gold Fields (45.29%) and AngloGold Ashanti (-9.16%). Since its operational update was released in November, the share price has advanced close to 27%, reflecting the market’s optimism in the company’s prospects, as the report showcased strong operating performance across all the company’s operations, resulting in higher gold production and a substantial rise in free cash flow generation.
From an external perspective, the strong share price performance looks poised to continue when analysing the trends in the gold market. Major central banks have recently hinted at the possibility of cutting interest rates globally, which could be a massive tailwind for gold, as it is a non-yielding metal. In the US, the CME FedWatch Tool is predicting a probability close to 40% that interest rates will fall in the range of 350bps – 375bps, suggesting 175bps of easing in the upcoming year, with the first cut slated for March.
With the possibility of higher gold prices throughout the year, the company also looks fundamentally strong to benefit from these tailwinds. In its latest operational report, the company reported a whopping 278% increase in operating free cash flow to R3,236 million, driven by an 18% increase in underground recovered grades from 5.35g/t to 6.29g/t. Total gold production increased by 17% from 11,301kg (363,336 ounces) to 13,233kg (425,130 ounces), and management acknowledged their confidence that the good momentum will continue, as they remain on track to meet their annual production guidance of 1,380,000 ounces to 1,480,000 ounces. Along with the higher production, the average gold price received was up by 18% to R1,127,208/kg or $1,881 per ounce, which resulted in a 33% increase in gold revenue to R14,781 million.
Apart from gold, silver production from Hidden Valley was also up, increasing by 55% to 30,914kg (993,914 ounces). With the average silver price received advancing by 35%, Harmony managed to generate R433 million in silver revenue from Hidden Valley. Uranium production increased by 50% to 70,044kg, while sold Uranium surged by 116% to 92,987kg, resulting in revenue of R223 million, as the average uranium price received also expanded nicely by 24%.
On the cost side, Harmony has also made progress in managing expenses and reported a year-on-year decline across all of its cost metrics per unit. Over these three months, cash operating costs were down 6% at R711,999/kg, while its all-in-sustaining costs(AISC) declined by 7% to R841,436/kg. With a substantial uptick in free cash flows and effective cost management, the company has further managed to strengthen its balance sheet, as it reduced net debt from R2,726 million a year ago to R117 million in the latest quarter.
Summary
Harmony enjoyed a successful year in 2023, with its share price appreciating over 60% since last January. However, the new year is off to a rocky start, with a loss of life incident occurring at its Mponeng mine and its share price already losing 6% in the opening weeks. As we advance, fundamental tailwinds could boost the company’s prospects. The dovish outlook for global monetary policy could underpin the gold price, and its latest operational update suggests that the company is well on track to meet its production targets for the year while efficiently managing costs. All eyes will now be on their half-year results, due in February, to get additional insights into the company’s performance in the opening half of its 2024 fiscal year.
Sources: Koyfin, Tradingview, Reuters, CME Group, Harmony Gold Mining Company Limited
Piece written by Tiaan van Aswegen, Trive Financial Market Analyst
Disclaimer: Trive South Africa (Pty) Ltd (hereinafter referred to as “Trive SA”), with registration number 2005/011130/07, is an authorised Financial Services Provider in terms of the Financial Advisory and Intermediary Services Act, 37 of 2002. Trive SA is authorised and regulated by the South African Financial Sector Conduct Authority (FSCA) and holds FSP number 27231. Trive Financial Services Ltd (hereinafter referred to as “Trive MU”) holds an Investment Dealer (Full-Service Dealer, excluding Underwriting) Licence with licence number GB21026295 pursuant to section 29 of the Securities Act 2005, Rule 4 of the Securities Rules 2007, and the Financial Services Rules 2008. Trive MU is authorized and regulated by the Mauritius Financial Services Commission (FSC) and holds Global Business Licence number GB21026295 under Section 72(6) of the Financial Services Act. Trive SA and Trive MU are collectively known and referred to as “Trive Africa”.
Market and economic conditions are subject to sudden change which may have a material impact on the outcome of financial instruments and may not be suitable for all investors. Trive Africa and its employees assume no liability for any loss or damage (direct, indirect, consequential, or inconsequential) that may be suffered. Please consider the risks involved before you trade or invest. All trades on the Trive Africa platform are subject to the legal terms and conditions to which you agree to be bound. Brand Logos are owned by the respective companies and not by Trive Africa. The use of a company’s brand logo does not represent an endorsement of Trive Africa by the company, nor an endorsement of the company by Trive Africa, nor does it necessarily imply any contractual relationship. Images are for illustrative purposes only and past performance is not necessarily an indication of future performance. No services are offered to stateless persons, persons under the age of 18 years, persons and/or residents of sanctioned countries or any other jurisdiction where the distribution of leveraged instruments is prohibited, and citizens of any state or country where it may be against the law of that country to trade with a South African and/or Mauritius based company and/or where the services are not made available by Trive Africa to hold an account with us. In any case, above all, it is your responsibility to avoid contravening any legislation in the country from where you are at the time.
CFDs and other margin products are complex instruments and come with a high risk of losing money rapidly due to leverage. You should consider whether you understand how these products work and whether you can afford to take the high risk of losing your money. Professional clients can lose more than they deposit. See our full Risk Disclosure and Terms of Business for further details. Some or all of the services and products are not offered to citizens or residents of certain jurisdictions where international sanctions or local regulatory requirements restrict or prohibit them.