Echoes from the 2008 global financial crisis have market participants scurrying for safety in what has been termed the second-biggest bank failure in U.S. history. On the 10th of March 2023, a significant technology lender, Silicon Valley Bank, collapsed and succumbed to a “classic bank run” when the financial giant “took a multibillion-dollar loss cashing out U.S. government bonds to raise money to pay depositors” as they attempted to withdraw a whopping $42 billion from the bank.
What Caused the Run on Silicon Valley Bank?
In what many financiers consider “probably the quickest bank run in history,” the collapse of Silicon Valley Bank is the most extensive demise of an American financial institution since Washington Mutual, which failed fifteen years ago amidst the 2008 global financial meltdown.
The collapse of Silicon Valley Bank can be attributed to its tremendous exponential growth during a time, specifically following the eruption of the COVID-19 Pandemic, when market participants were heavily investing in technology startups to capitalise from the “ultra-low” interest-rate environment in hopes for higher returns. With Silicon Valley Bank “trebling deposits in just three years,” growth in excess liquidity soared as the financial institution saw its loan-to-deposit ratio – a measure of liquidity where a lower ratio indicates greater liquidity – fall to levels lower than 69%, “the current level for all U.S. banks taken together.” In essence, the demise of Silicon Valley Bank was not a simple case of insufficient liquidity but rather too much risk the bank took by ploughing “most of its spare cash into long-term, mainly government-backed, bonds.” In a heated battle against inflation, the FED’s aggressive rate-hiking cycle saw the value of these fixed-income securities decline significantly.
Silicon Valley Bank invested much of its spare cash in government-backed fixed-income securities. This decision would ultimately be one of the predominant factors influencing the bank’s collapse. The now-infamous tech lender “had 57% of its assets in bonds and other securities at the end of 2022,” all of which incurred significant market-value losses as the FED persisted in hiking rates to curb surging inflation levels. Despite an uptick in market-value losses, the change in the valuation of the government-backed bonds would not be of significant concern unless Silicon Valley Bank was forced to sell the securities and essentially realise the losses, which is precisely what happened.
2022 prevailed as a particularly tough and turbulent year for the stock market in general, “with the S&P 500 [index] ending the year down nearly 20%.” More specifically, the technology sector saw a tremendous downturn in performance as the Dow Jones U.S. Technology Index closed the year down more than 30%. Honing in on the NASDAQ Composite Index, 2022 was the first year the tech-heavy index saw four consecutive quarters of declining values. While last year proved troublesome for most, technology-oriented investors saw 2022 as “the third-worst year for tech after 2008 and the bursting of the dot-com bubble in 2000.” Consequently, many tech startups saw their venture capital funding deteriorate and naturally resorted to “drawing on their deposits,” many of which were at Silicon Valley Bank. To satisfy client withdrawals, the financial institution elected to sell many of these bonds, realising $1.8 billion in market value losses, spooking more and more investors and clients who, in turn, elected to withdraw their deposits.
As panic spread, the run on Silicon Valley Bank resulted in the second-largest bank failure in U.S. history and the largest since 2008. In the weeks following the run, Silicon Valley Bank has “since been partly taken over by First Citizens and partly by the Federal Deposit Insurance Corporation.”
Let’s look at the four largest Banks in the US:
JPMorgan Chase & Co (NYSE: JPM)
JPMorgan Chase & Co, perhaps one of the most admired companies in the world, reported a 2022 fourth-quarter Common Equity Tier 1 (CET1) ratio of 13.2%, up from 12.5% for the prior quarter. The Corporate Finance Institute states, “Basel III requires that the equity component of Tier 1 capital should be at least 4.5% of risk-weighted assets.” Moreover, the firm’s fourth-quarter Liquidity Coverage Ratio (LCR) decreased to 112% from 113% in the prior quarter.
Technical Analysis
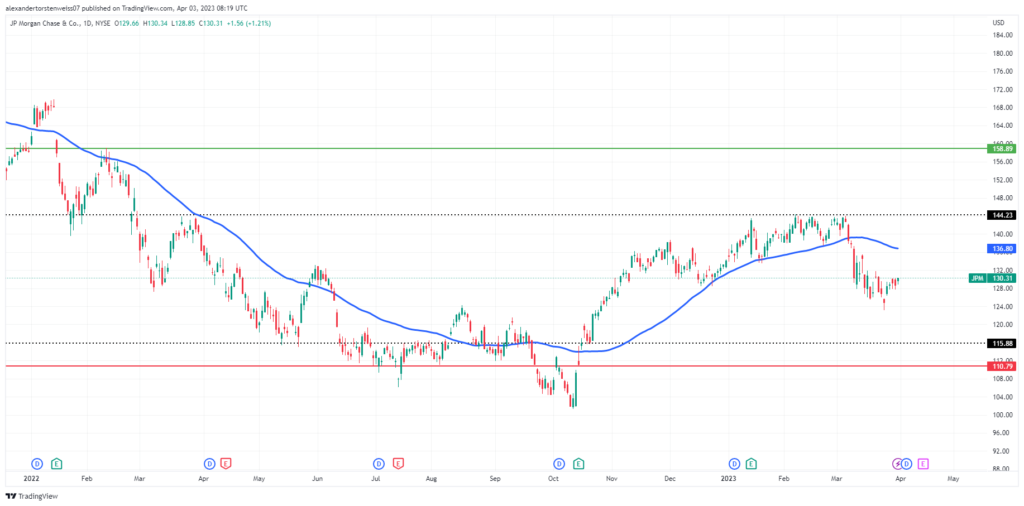
The price action on the world’s largest bank by market capitalisation has been consolidating sideways for the last five months, with the primary support and resistance levels at $115.88 (black dotted line) and $144.23 (black dotted line), respectively.
Should the recent downtrend persist amidst fears of financial contagion, the bears could see the share price decline toward the $115.88 support level or even fall further toward the significant support level at $110.79 (red line), which could be watched closely as a potential entry point for long-term investors. For the bull case, the price action could push above the $144.23 resistance level, a share level toward the primary price resistance of $158.89 (green line).
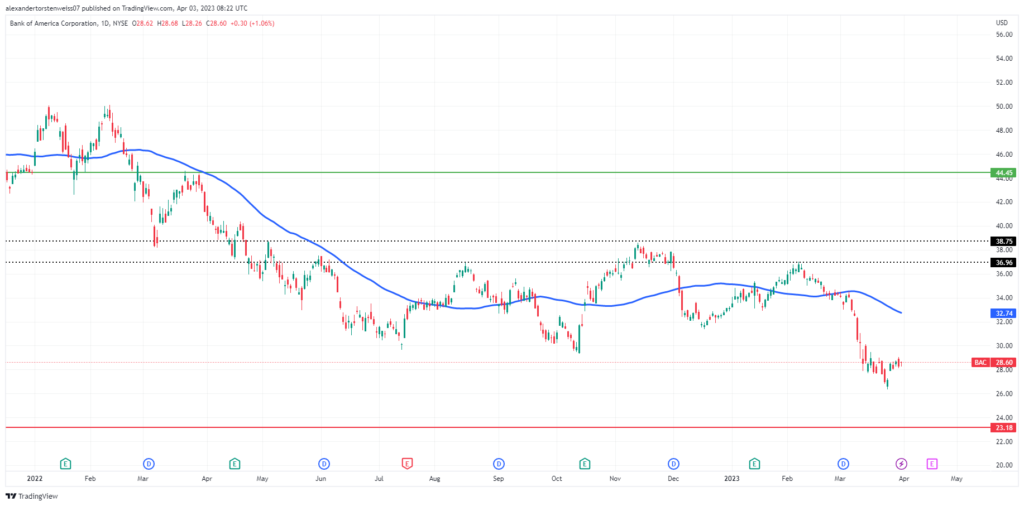
Bank of America (NYSE: BAC)
The American multinational investment bank and financial services holding company reported a 2022 fourth-quarter CET1 ratio of 11.2%, up from 11% for the prior quarter. On a year-over-year basis, Bank of America has seen its fourth-quarter CET1 ratio increase from 10.6% to 11.2% as its fourth-quarter common equity tier 1 capital increased from $171.8 billion to $180 billion.
Technical Analysis
The price action on Bank of America has decreased since testing the $36.96 resistance level (black dotted line) in early February 2023. Should the recent downtrend persist, the share price could decline further toward the primary support level of $23.18 (red line). The bulls could see the price action retrace and push higher toward the $36.96 resistance level. Should the price breach this resistance, the share price can increase toward the $38.75 resistance level (black dotted line), a share level toward the primary resistance of $44.45 (green line).
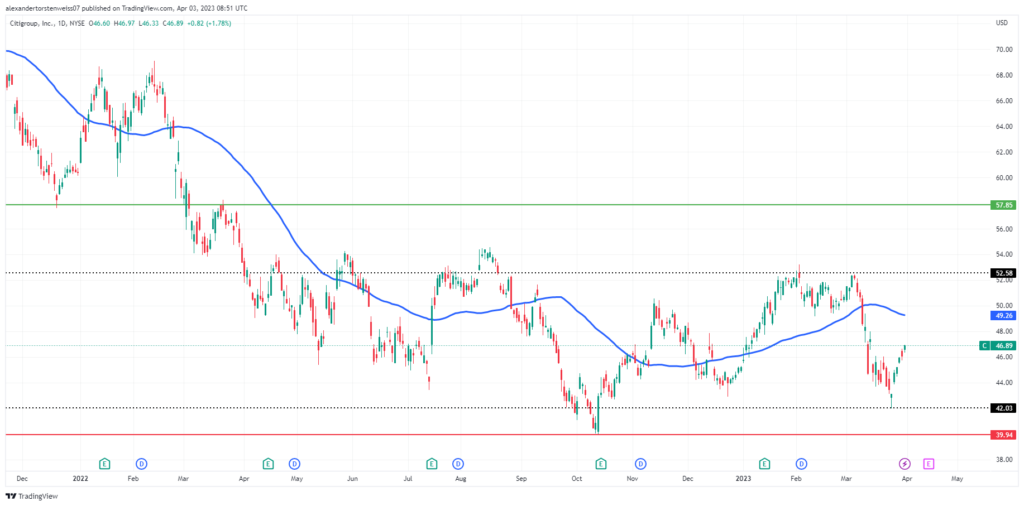
Citigroup (NYSE: C)
Citigroup reported a 2022 fourth-quarter CET1 capital ratio of 13%, significantly up from the 12.3% reported in the prior quarter. On a year-over-year basis, the investment banking giant saw its CET1 ratio increase from 12.2% in 2021 to 13% in 2022.
Technical Analysis
Last testing the $52.58 resistance level (black dotted line) in early March, Citigroup has seen its price action trend significantly lower toward the $42.03 support level (black dotted line) as fear erupted among market participants following the second-largest bank failure in U.S. history. Since testing the $42.03 support level, the price action has retraced, pushing higher. Should the uptrend continue, the bulls could see the share price push higher toward the $52.58 resistance level, a share level toward the primary resistance level of $57.85 (green line).
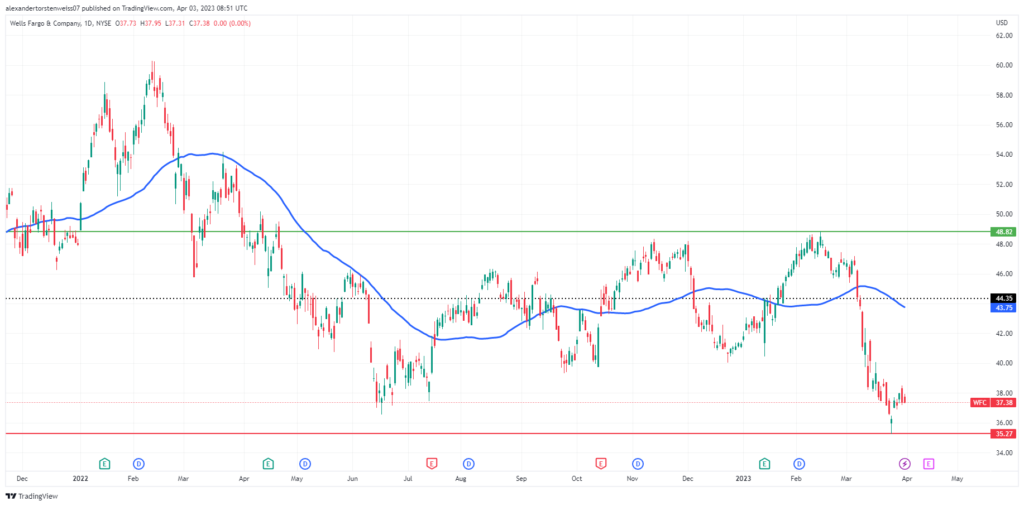
Wells Fargo & Company (NYSE: WFC)
Wells Fargo & Company reported a quarterly CET1 ratio of 10.6% for the quarter that ended on the 31st of December 2022, slightly up from the 10.3% reported in the prior quarter. However, on a year-over-year basis, the group has seen its fourth-quarter CET1 ratio decline from 11.4% to 10.6% but remains well above the regulatory minimum.
Technical Analysis
Last testing the significant resistance level at $48.82 (green line) in February, the price action on Wells Fargo has declined tremendously toward the support level at $35.27 (red line). The bulls will be hoping for some relief and a retracement for the price to push higher toward the $44.35 resistance level (black dotted line), which market participants will watch closely. Should the price action increase toward the $44.35 resistance level and breach this level, the share price may increase to the significant resistance level of $48.82. The bears could see the $35.27 level act as considerable support should the recent downtrend persist.
Summary
The collapse of Silicon Valley Bank, marking the second-largest bank failure in U.S. history, has seen a wave of negative sentiment enter the market, dragging banking shares lower as market participants scurry for safety amid fears of financial contagion. The recent banking turmoil has seen the share prices of America’s largest banks – JPMorgan Chase, Bank of America, Citigroup, and Wells Fargo – trend significantly lower.
Sources: Bank Policy Institute, Bank of America, Bloomberg, Citigroup, Corporate Finance Institute, Forbes, JPMorgan Chase & Co., Wells Fargo, Trading View
Disclaimer: Trive South Africa (Pty) Ltd, Registration number 2005/011130/07, and an Authorised Financial Services Provider in terms of the Financial Advisory and Intermediary Services Act 2002 (FSP No. 27231). Any analysis/data/opinion contained herein are for informational purposes only and should not be considered advice or a recommendation to invest in any security. The content herein was created using proprietary strategies based on parameters that may include price, time, economic events, liquidity, risk, and macro and cyclical analysis. Securities involve a degree of risk and are volatile instruments. Market and economic conditions are subject to sudden change, which may have a material impact on the outcome of financial instruments and may not be suitable for all investors. When trading or investing in securities or alternative products, the value of the product can increase or decrease meaning your investment can increase or decrease in value. Past performance is not an indication of future performance. Trive South Africa (Pty) Ltd, and its employees assume no liability for any loss or damage (direct, indirect, consequential, or inconsequential) that may be suffered from using or relying on the information contained herein. Please consider the risks involved before you trade or invest.