A much softer-than-expected recovery in China’s economy has dealt a severe blow to the platinum spot price and, in turn, to platinum shares, whose share prices have been hammered. Impala Platinum Holding Limited, whose share price has fallen 44.54% this year, is leading the losers. Sibanye-Stillwater and Anglo-American Platinum Limited are behind, falling by roughly 43.12% and 35.6%, respectively.
The platinum price has been in free fall since the May of this year, and in April of this year, the price per ounce was at a yearly high of $1132.17. Optimism for the precious metal was high after the Chinese economy reopened in December 2022. On the last day of the second quarter, the price of platinum got to a low of $885.69 a fine ounce. Platinum is one of the rarest metals in the world and is mainly used to make vehicle catalytic converters, as well as in chemical and electrical industries and petroleum refineries. South Africa is the hub of platinum production globally, accounting for 80% through companies such as Northam Platinum Limited, Anglo American Platinum, Impala Platinum, and Sibanye Stillwaters Limited.
Year-To-Date, the platinum price has decreased by 16.17%, and the Rand against the Greenback has weakened by 10.65%. The graph below shows the escalating situation over the past few weeks and how it has impacted the four platinum shares indicated in the chart below.
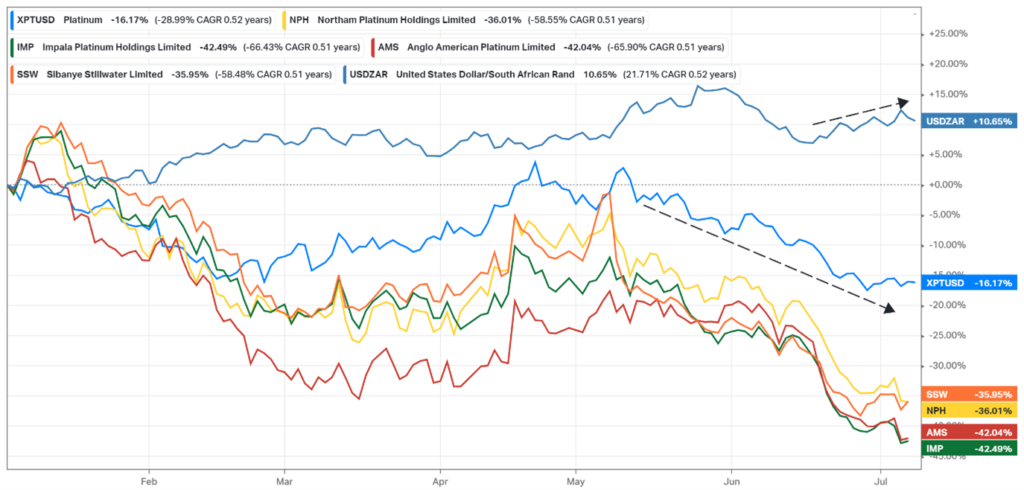
Figure 1: Year to Date chart of Platinum miners, the Platinum Spot price, and USD/Rand cross
The demand for platinum is anticipated to increase over the long term, driven by factors like tighter pollution restrictions in the automobile industry, a rise in the adoption of fuel cell vehicles, and potential expansion in industrial applications.
It’s important to note that the performance of the platinum sector can be subject to a range of factors beyond the demand and price of platinum. These factors may include operational efficiency, infrastructure changes in South Africa (load shedding), and geopolitical developments such as the tension between the United States and China. Due to South Africa’s supremacy in the production of platinum, its miners have an edge over rivals since they have access to significant platinum reserves.
China’s stalled recovery
The world’s second-largest economy is dealing with the consequences of the synchronised crackdown on property, education, platform economy, and Covid zero. The country’s economy stalled in Q2, with forecasts in industrial production (orange) and retail sales (blue) missed and coming below expected, and headline inflation (green) is currently zero. High unemployment, especially among the country’s youth, reached a historic high of 20.8% in May.
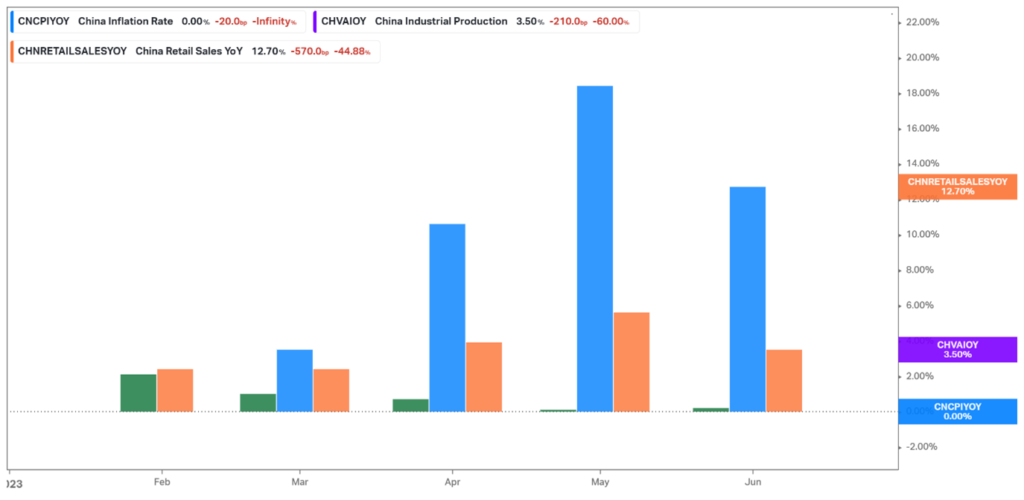
Figure 2: Chart of the Chinese inflation rate, industrial production, and retail sales in 2023
Additionally, concerning has been the continuation of the trade war between the world’s top two economies, which started in the Trump years. Recently, Beijing has imposed restrictions on exporting two metals, gallium and germanium, crucial to parts of the semiconductor, telecommunications, and electric-vehicle industries. This follows a ban by the United States of America for specific tools or chips made using American technology that cannot be exported to China.
US Treasury Secretary Yellen went to Beijing to boost cooperation with the United States and called on China to end what she calls “unfair economic practices” as the trip concluded earlier this morning. She has stated that more communication is needed between the two economic giants. Regarding platinum export, South Africa’s main export partners are China, the United States of America, and Germany.
Technical Analysis
In analysing the daily candle stick chart for the Platinum Spot price since the beginning of 2022, we have observed that the price has touched highs at $1339.39 in February 2021 and the support line at $800 in September 2022. The support line has been tested over the years, and the platinum price traded below $800 before 2003.
There is a double bottom formation around $900 a fine ounce on a shorter time frame. The chart pattern may play out as the price is close to the top line of the downward channel trend line. Examining the downward trend line further, one can note that an Elliot Impulse Wave formed with four of five turning points observed. Should the Elliot Wave pattern continue to develop, more downside for the platinum Spot price is still on the cards, with the support line as a potential target point.
Looking at the Relative Strength Index (RSI) has indicated some moved out of the over-bought territory it was in the last days of June. We are noting that the RSI is moving closer to 50% and is above the 14-day simple moving average in the RSI at the time of writing this article. Lastly, looking at the 200-day and 50-day Exponential Moving Averages have formed a death cross on the last day of June 2023.
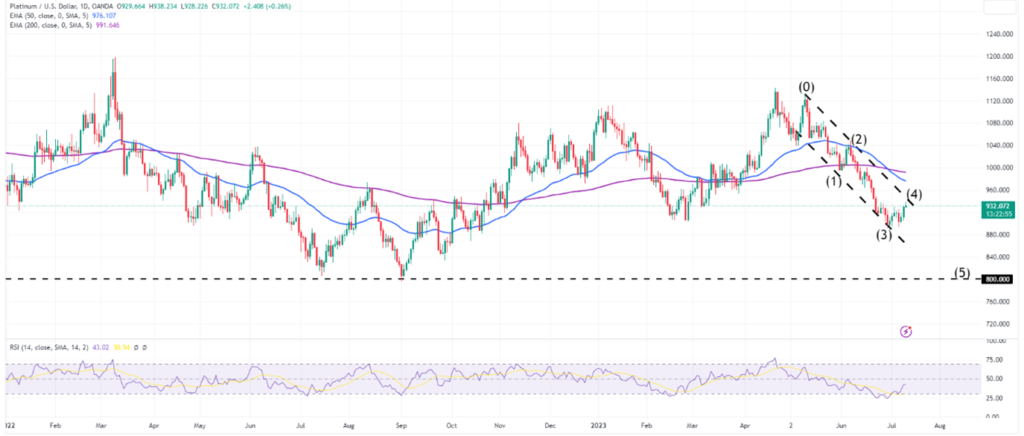
Figure 3: Platinum Spot daily chart from the beginning of 2022
Fundamentals
The financial state of the platinum miners remains in good condition in contradiction to the share price performance. Northam Platinum Holdings Limited has been steadily growing as a business, with the net income margin of the platinum miner above 28% in the 2021 and 2022 financial years. Notably, Northam Platinum Holdings Limited is the only one of the five platinum producers used in the comparative analysis done later in the article that has a positive Net Debt, with the rest with a substantial war chest in cash reserves to produce negative Net Debt. Impala Platinum Holding Limited and Anglo American Platinum Limited maintained a nearly 30% Net Income Margin and reported close to R30 billion in cash reserves in the companies’ 2022 annual results. Sibanye Stillwater Limited has continued declining in the Net Income Margin since the 2020 financial year. In 2020, the Net Income Margin was a hair above 23% and has dropped to 13% in the 2022 financial year. Lastly, Royal Bafokeng Platinum Limited saw a decline in the Net Income Margin between the 2021 and 2022 annual results but still delivered 20% on the latter with cash reserves of R4.353 billion.
Comparative Valuation Analysis
For the comparative valuation analysis that the team conducted, we found that the most exciting company was Sibanye Stillwater Limited. According to the valuations done on the company using EV/Revenue, EV/EBIT, and P/E ratios, the company has a substantial upside of almost double the current share price. The high-end valuation is thanks to the EV/Revenue ratio calculation, but it is worth noting that the P/E ratio calculates the valuation at the current share price.

Summary
The platinum miners have been dealt a bad hand with the current move in the Platinum Spot and weakening of the Rand against the US Dollar despite having large cash reserves and good net income margins. As investors, we have no choice but to wait with bated breath to see how the platinum price will fair out for the remained of the year.
Sources: Koyfin, Trading View, CNBC, Bloomberg, Trading Economics and Yahoo Finance
Analyst: Odwa Magwentshu, FMVA
Disclaimer: Trive South Africa (Pty) Ltd, Registration number 2005/011130/07, and an Authorised Financial Services Provider in terms of the Financial Advisory and Intermediary Services Act 2002 (FSP No. 27231). Any analysis/data/opinion contained herein are for informational purposes only and should not be considered advice or a recommendation to invest in any security. The content herein was created using proprietary strategies based on parameters that may include price, time, economic events, liquidity, risk, and macro and cyclical analysis. Securities involve a degree of risk and are volatile instruments. Market and economic conditions are subject to sudden change which may have a material impact on the outcome of financial instruments and may not be suitable for all investors. When trading or investing in securities or alternative products, the value of the product can increase or decrease meaning your investment can increase or decrease in value. Past performance is not an indication of future performance. Trive South Africa (Pty) Ltd, and its employees assume no liability for any loss or damage (direct, indirect, consequential, or inconsequential) that may be suffered from using or relying on the information contained herein. Please consider the risks involved before you trade or invest.