Despite the opportunities that high-growth equity securities offer investors, a magnetic allure draws some towards the steady rhythm of consistent income. Amidst the quest for soaring profits, there’s an appreciation for the reliability of dividends. High-growth prospects may be a selling point, but the SPDR S&P Dividend ETF (NYSE Arca: SDY) takes a different route. This fund offers not just diversification across multiple sectors but a soothing shield of income in the tumultuous world of equities.
This fund invests primarily in the equity markets in the United States and offers investors exposure to both growth and value-oriented companies that provide lucrative dividend yields. It seeks to track the S&P High Yield Dividend Aristocrats Index, an index designed to measure the performance of the highest dividend-yielding companies in the S&P Composite 1500 Index that have followed a dividend policy of consistently increasing their dividends for at least 20 consecutive years. With 121 holdings, the fund has an estimated 3-5-year EPS growth of 7.15% while operating with a 3.19% index dividend yield.
Technical
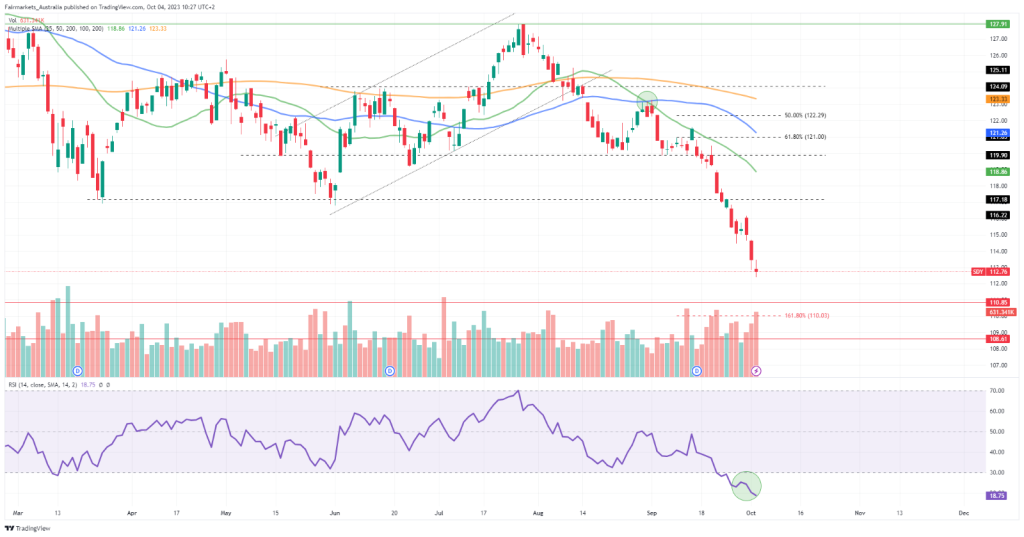
On the 1D chart, the fund’s price has emerged in a sustainable downtrend after breaking down the dynamic support of a prior ascending channel. The 200-SMA (orange line) trades above the 50-SMA (blue line), which has recently crossed above the 25-SMA (green line) in a signal of bearish momentum. However, the RSI indicates oversold conditions, leaving the door open for a potential technical retracement.
Resistance is established at $117.18 and $119.90, which could prevent a sustainable retracement toward retesting the 61.8% Fibonacci golden ratio at $121.00. The 50-SMA provides additional resistance at this level, which could initially prevent the price from reaching higher levels at $122.29 and $124.09 to cross above the 200-SMA.
If the current momentum continues, the elevated volumes could drag the price toward support at $110.85. From there, the 161.8% Fibonacci extension could provide a lifeline to the fund’s price, potentially enticing the market to buy into the reversal at $110.03. If this fails to materialize, the price could continue trickling down toward $108.61 in the longer term.
Fundamental
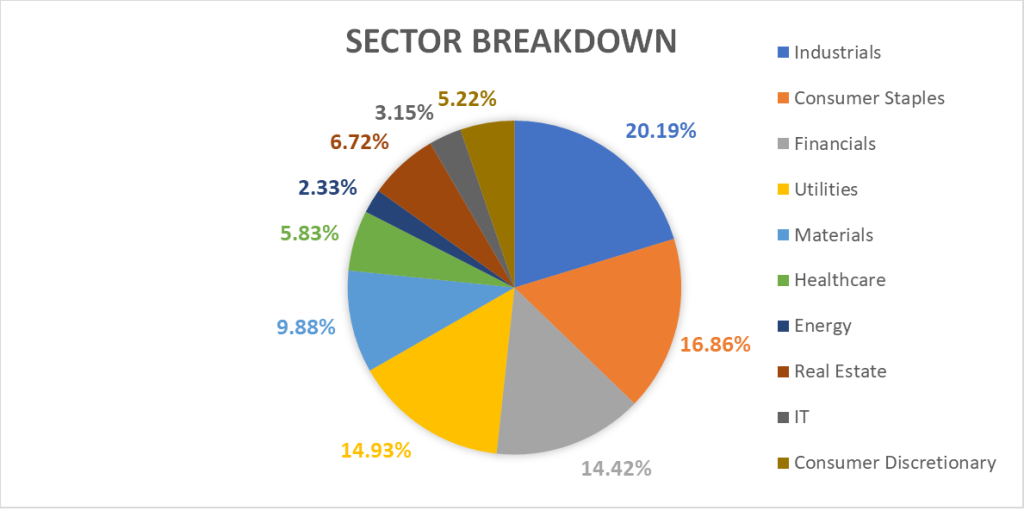
While the fund’s primary focus is centred around dividend income, it provides diversified exposure to multiple sectors in the US market. The industrial sector attributes the most significant portion of the company’s holdings, followed by consumer staples, financials, and utilities. Therefore, investors could gain exposure to cyclical stocks, such as industrials and the small portion of information technology holdings, while being insulated by non-cyclical companies, such as consumer staples, and enjoying the added benefit of quarterly dividend payments. Company-specific risks are effectively diversified away, and with a beta of 0.86, it is essentially less volatile than the overall market. Its price/book ratio is relatively low at 2.42x, reflecting the value tilt with a slight exposure to growth.
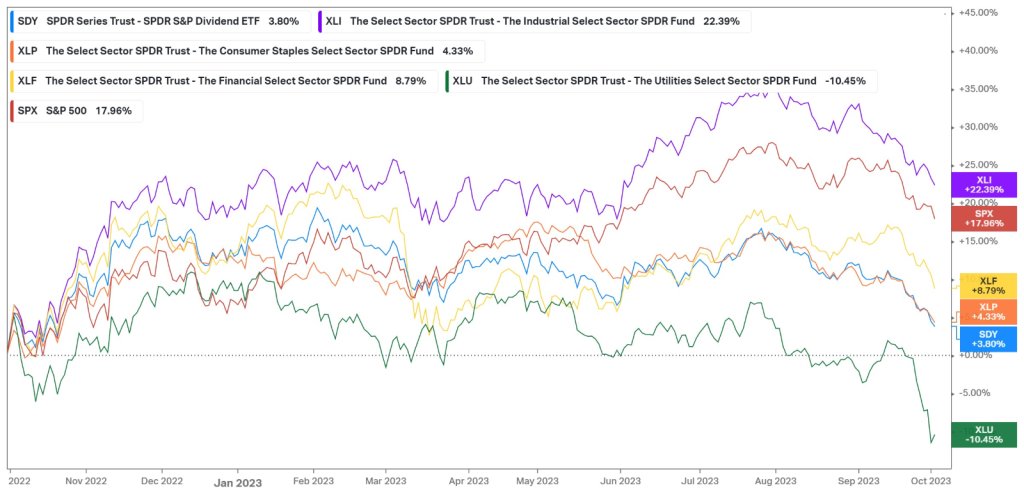
However, the graph below demonstrates the performance of its main sectors over the last year. While the industrial sector (22.39%) has outperformed the S&P 500 (17.96%), the fund’s 3.80% total return has been dragged down by underperformance in utilities (-10.45%), as well as financials (8.79%) and consumer staples (4.33%). In recent weeks, the cyclicality of the industrial sector has weighed on its performance as well, with rising interest rates in the economy dampening the demand for construction, which could result in a cyclical downturn in the sector over the next few months as the Federal Reserve maintains its higher for longer agenda.
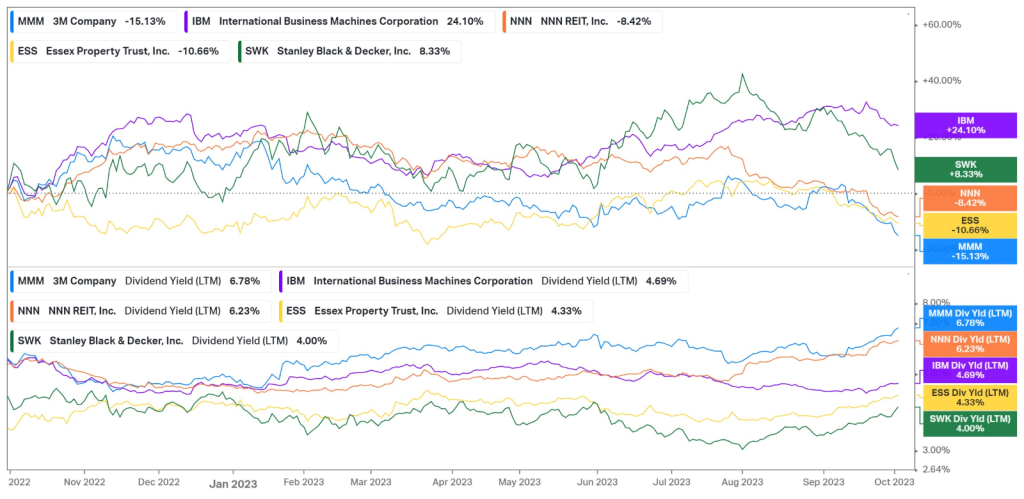
According to its fact sheet, as of the 30th of June 2023, the biggest single stock holding in the fund is the 3M company, which has suffered a 15.13% contraction in its total return over the last month. However, its second-largest holding, International Business Machines Corporation, has offset these losses with a 24.10% expansion. The other three companies comprising its top five holdings have generated a total return between these parameters. However, it is worth noting the dividend yields of these companies. 3M Company operates with a 6.78% dividend yield, with the lowest dividend yield in its top 5 holdings being 4%. While these are attractive dividend yields, it is important to be aware of the inverse relationship between the dividend yield and the company’s share price, and the lacklustre performance of some of its holdings may have boosted the dividend yield of the fund without sustainable increases in the dividends per share of the respective holdings. Additionally, higher dividend payments take away the company’s ability to reinvest its earnings into growth prospects, essentially lowering its growth potential.
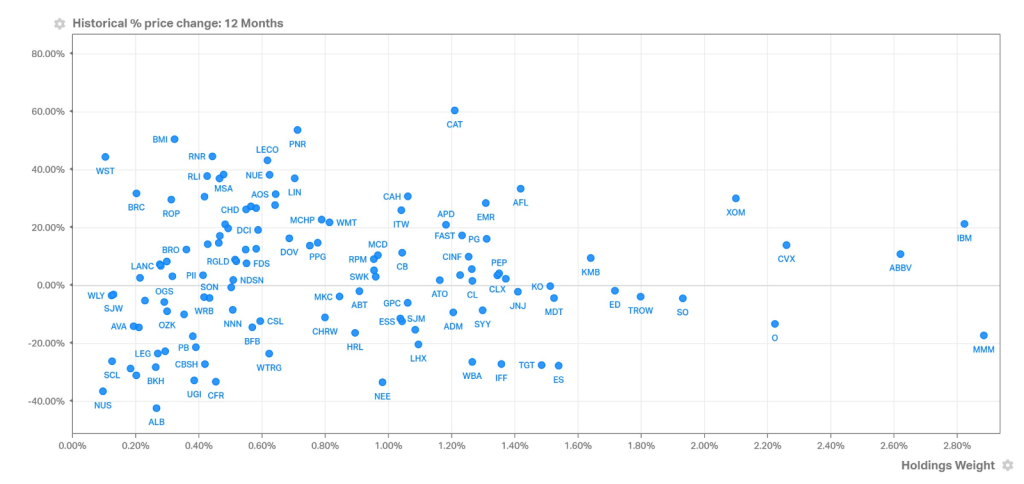
Interestingly enough, the graph below shows the relative underperformance of the fund’s larger holdings over the last year compared to its more minor positions. Caterpillar has produced the highest price change among the fund’s holdings over the previous year but only attributes about 1.2% of the overall fund positions. Similarly, 3M company is among the worst-performing stocks in the fund despite holding the most significant portion of allocated funds. However, on the back of the surging oil price, companies like Exxon Mobil and Chevron have generated lucrative returns and are becoming a more significant part of the company’s allocation.
Summary
The SPDR S&P Dividend ETF offers diversified exposure to both value and growth companies in the US equity market that operates with lucrative dividend yields. In times of share price volatility, the safety of a constant income stream attracts some investors despite the opportunity cost of higher-growth companies that can take advantage of large market upswings. While currently in a strong downtrend, there could be a technical reversal at the $110.85 support level, leaving the door open for a retracement toward $119.90 and $127.91 in the longer term.
Sources: Koyfin, Tradingview, State Street Global Advisors
Piece written by Tiaan van Aswegen, Trive Financial Market Analyst
Disclaimer: Trive South Africa (Pty) Ltd, Registration number 2005/011130/07, and an Authorised Financial Services Provider in terms of the Financial Advisory and Intermediary Services Act 2002 (FSP No. 27231). Any analysis/data/opinion contained herein are for informational purposes only and should not be considered advice or a recommendation to invest in any security. The content herein was created using proprietary strategies based on parameters that may include price, time, economic events, liquidity, risk, and macro and cyclical analysis. Securities involve a degree of risk and are volatile instruments. Market and economic conditions are subject to sudden change, which may have a material impact on the outcome of financial instruments and may not be suitable for all investors. When trading or investing in securities or alternative products, the value of the product can increase or decrease meaning your investment can increase or decrease in value. Past performance is not an indication of future performance. Trive South Africa (Pty) Ltd, and its employees assume no liability for any loss or damage (direct, indirect, consequential, or inconsequential) that may be suffered from using or relying on the information contained herein. Please consider the risks involved before you trade or invest.