Aspen Pharmacare Holdings Limited (JSE: APN) navigated a dynamic year marked by notable achievements. Experiencing a commendable surge, its share price climbed nearly 20% in the past twelve months, outpacing the 5.72% price return of the JSE Top 40 Index.
However, investor sentiments shifted following the latest earnings report for the fiscal year ending on June 30, 2023, revealing a 7.9% contraction. Despite increased revenue, coming in at R40.71Bn, the company reported a decline in profit attributable to shareholders from R6.49Bn to R5.23Bn. Subsequently, the stock price entered a consolidation phase, adopting a rectangle pattern as it awaits the cues for its next decisive move.
Technical
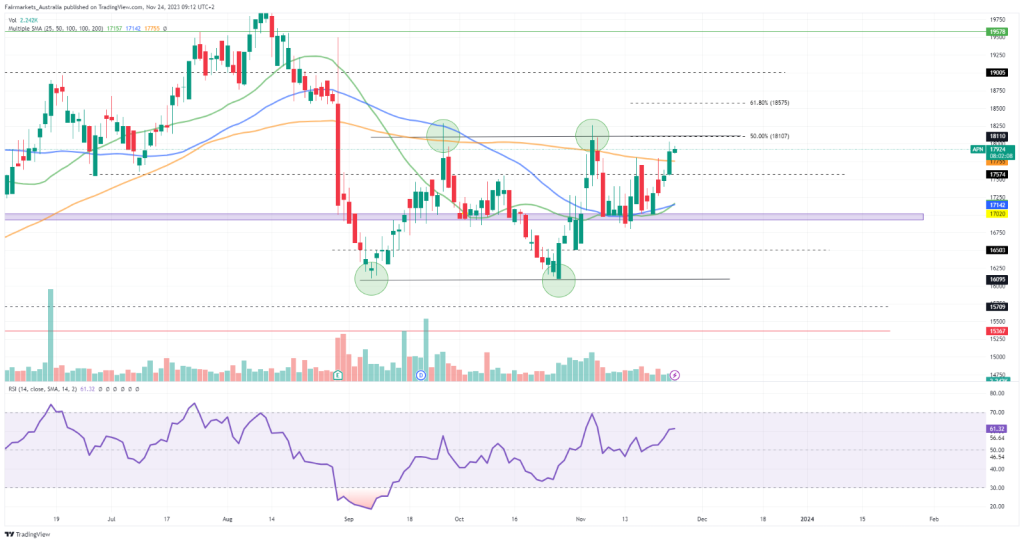
The rectangle pattern is evident on the 1D chart, with the price approaching the psychological resistance of the rectangle at R181.10, which lies at the 50% Fibonacci retracement level. The bulls have failed to break above this level twice before, making it pivotal in the upcoming sessions.
Should the resistance once again prevent additional upside, a pullback toward R175.74 becomes likely. From there, a demand zone at R171.42 lies close to the 50-SMA (blue line) and the 25-SMA (green line), marking a strong support level. A breakdown here could open the door for bearish momentum to retest the rectangle’s support at R160.95, where a pivot could occur again.
However, the 25-SMA is converging with the 50-SMA, looking to cross above in a signal that sentiment is shifting. With buyers present in the short term, a breakout above R181.10 could result in a test of the Fibonacci golden ratio at R185.75. A temporary retracement could be enforced at this level to test the sustainability of the breakout, with higher resistance at R190.05 and R195.78 becoming key levels of interest should the upturn be sustained.
Summary
Despite a fruitful last twelve months, investors sold off Aspen’s stock after its latest earnings report, with consolidation now occurring at the bottom of the prior downtrend. Resistance at R181.10 could be crucial in the upcoming sessions to determine whether the bullish momentum could break through the rectangle or whether the current pattern will continue.
Sources: Koyfin, Tradingview, Reuters, Aspen Pharmacare Holdings Limited
Piece written by Tiaan van Aswegen, Trive Financial Market Analyst
Disclaimer: Trive South Africa (Pty) Ltd, Registration number 2005/011130/07, and an Authorised Financial Services Provider in terms of the Financial Advisory and Intermediary Services Act 2002 (FSP No. 27231). Any analysis/data/opinion contained herein are for informational purposes only and should not be considered advice or a recommendation to invest in any security. The content herein was created using proprietary strategies based on parameters that may include price, time, economic events, liquidity, risk, and macro and cyclical analysis. Securities involve a degree of risk and are volatile instruments. Market and economic conditions are subject to sudden change, which may have a material impact on the outcome of financial instruments and may not be suitable for all investors. When trading or investing in securities or alternative products, the value of the product can increase or decrease meaning your investment can increase or decrease in value. Past performance is not an indication of future performance. Trive South Africa (Pty) Ltd, and its employees assume no liability for any loss or damage (direct, indirect, consequential, or inconsequential) that may be suffered from using or relying on the information contained herein. Please consider the risks involved before you trade or invest.