
Deere & Company (NYSE: DE) faced a rocky road after its recent earnings report. Despite appearing promising initially, the numbers revealed a complex tale. Although beating market predictions with sales at $13.80Bn against a forecast of $13.66Bn and an earnings per share of $8.26 surpassing the anticipated $7.46, there were telling dips, which led to the share price slipping by over 3%.
The Production & Precision Agriculture branch slid by 6% to $6.97Bn due to lower volumes countering positive price shifts. Small Agriculture & Turf sales mirrored a similar decline of 13% to $3.74Bn, tracing back to diminishing volumes. In a turn of events, Construction & Forestry soared by 11% to $3.74Bn, riding high on amplified prices and volumes, while the Financial Services division rose by 36% to $1.35Bn.
Underneath these numbers lies a puzzle: a potential erosion of the company’s pricing power as it pushes for higher prices, only to witness declining volumes. Further complexity arises from the acknowledgement by the company’s management of shifting agricultural dynamics, signalling a looming drop in demand. With this in mind, the outlook for fiscal year 2024 appears dim, painted with expected sales slumps across all segments. The midpoint of net income guidance points to a troubling 21% decline from the preceding year. Forecasts predict a 15%-20% drop in Production & Precision Agriculture sales, a 10%-15% dip in Small Agriculture & Turf, and an additional 10% decline in Construction & Forestry. The numbers spell a challenging path ahead for Deere & Company, navigating through turbulent market shifts and evolving consumer demands in the cyclical industrial industry.
Technical
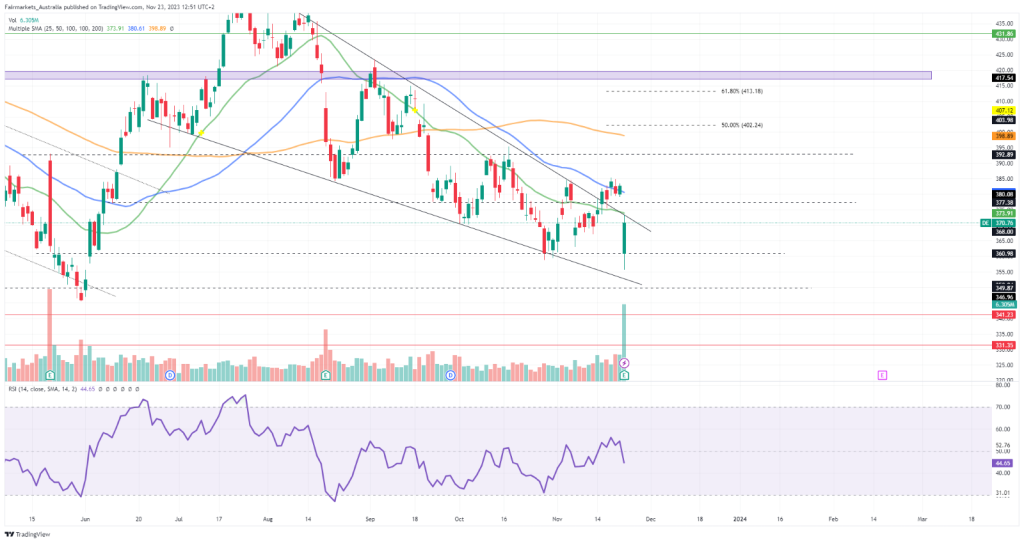
On the 1D chart, a descending wedge has emerged, suggesting a potential bullish breakout. However, the 100-SMA (orange line) lies above the 50-SMA (blue line) and 25-SMA (green line), indicating that the short-term momentum favours the bears, marking an intriguing inflexion point for the company’s share price.
With the 25-SMA offering resistance at $373.91, the price slipped after the earnings report until finding support at $360.98. As long as this support holds, the breakout remains in play. While the 25-SMA backs the dynamic resistance, a breakout could see the share price attempt to breach the 50-SMA at $380.61 to trigger a reversal in momentum. In this case, a sustainable uptrend may require a further breach of resistance at $392.89 before the Fibonacci midpoint could come into play at $402.24.
Conversely, a breakdown of support at $360.98 could be detrimental to the hopes of a wedge breakout, with support at $349.87 becoming pivotal in preventing a breakdown of the wedge for a steeper downtrend. Should the wedge break down, lower support at $341.23 and $331.35 could be potential interest levels to the downside.
Summary
As caution looms over Deere & Company’s demand prospects in the upcoming year, its share price tumbled. However, support at $360.98 kept the wedge breakout in play, making the 25-SMA a crucial level in the forthcoming sessions to determine whether a breakout could be sustained.
Sources: Koyfin, Tradingview, Reuters, Deere & Company
Piece written by Tiaan van Aswegen, Trive Financial Market Analyst
Disclaimer: Trive South Africa (Pty) Ltd, Registration number 2005/011130/07, and an Authorised Financial Services Provider in terms of the Financial Advisory and Intermediary Services Act 2002 (FSP No. 27231). Any analysis/data/opinion contained herein are for informational purposes only and should not be considered advice or a recommendation to invest in any security. The content herein was created using proprietary strategies based on parameters that may include price, time, economic events, liquidity, risk, and macro and cyclical analysis. Securities involve a degree of risk and are volatile instruments. Market and economic conditions are subject to sudden change, which may have a material impact on the outcome of financial instruments and may not be suitable for all investors. When trading or investing in securities or alternative products, the value of the product can increase or decrease meaning your investment can increase or decrease in value. Past performance is not an indication of future performance. Trive South Africa (Pty) Ltd, and its employees assume no liability for any loss or damage (direct, indirect, consequential, or inconsequential) that may be suffered from using or relying on the information contained herein. Please consider the risks involved before you trade or invest.