Tesla’s (NASDAQ: TSLA) share price faces headwinds on multiple fronts, with the report that the company recently missed delivery estimates by a significant margin in Q1 2024, with sales down 8.5% year-over-year, adding pressure on the share. This shortfall comes despite a production increase, suggesting potential weak demand. Increased competition from established automakers entering the EV space further threatens Tesla’s market share.
Adding to the pressure, higher interest rates and potential brand damage from CEO Elon Musk’s social media activity could further dampen consumer enthusiasm. However, some analysts remain optimistic. Tesla’s upcoming earnings report (April 23rd) and the potential for its Full Self-Driving technology to be a near-term catalyst are factors to consider. The company regaining the top EV seller spot globally, surpassing BYD, is also a point of note.
Technical Analysis
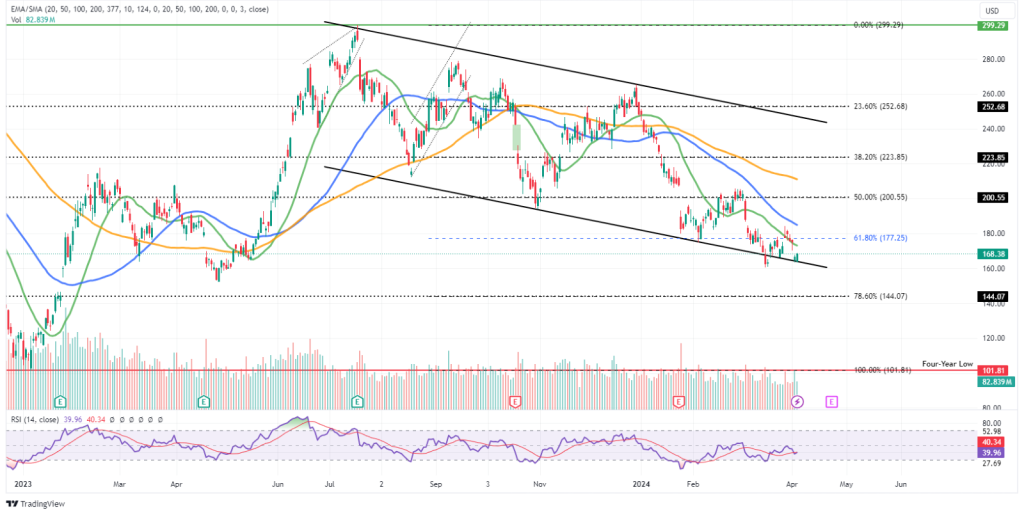
The 4-hour technical analysis paints a bearish picture. Tesla’s share price is currently trading within a descending channel, with the 50-SMA (blue line), 100-SMA (orange line), and 200-SMA (red line) all sloping downwards. This indicates a downtrend and the potential for further price decline. The RSI (Relative Strength Index) sits at 39.96, below 50, further highlighting bearish momentum. A sustained move lower could see the price fall towards the 78.60% Fibonacci retracement level of $144.07. A break below this level, with significant volume, could expose the four-year low of $101.81.
However, there’s a possibility for a reversal. Renewed buying pressure could see the price rise towards the 61.80% Fibonacci retracement level, with a break above this level could lead to a test of the 50% level at $200.55. A sustained surge past this point could signal a bullish reversal, with the 38.20% ($223.85) and 23.60% ($252.68) Fibonacci retracement levels potentially acting as the next upside targets.
Summary
Tesla’s outlook is clouded by weak deliveries, competition, and rising interest rates. Technically, the charts suggest a downtrend, with $144.07 and potentially even $101.81 as downside targets. However, bullish hopes hinge on the upcoming earnings report and the potential for Full Self-Driving technology. If the bulls regain control, $200.55 could be the next test, with a possibility of a further rise towards $223.85 and $252.68.
Sources: TradingView, Simply Wall Street, MarketWatch, Dow Jones Newswire, Benzinga.
Piece written by Mfanafuthi Mhlongo, Trive Financial Market Analyst
Disclaimer: Trive South Africa (Pty) Ltd (hereinafter referred to as “Trive SA”), with registration number 2005/011130/07, is an authorised Financial Services Provider in terms of the Financial Advisory and Intermediary Services Act, 37 of 2002. Trive SA is authorised and regulated by the South African Financial Sector Conduct Authority (FSCA) and holds FSP number 27231. Trive Financial Services Ltd (hereinafter referred to as “Trive MU”) holds an Investment Dealer (Full-Service Dealer, excluding Underwriting) Licence with licence number GB21026295 pursuant to section 29 of the Securities Act 2005, Rule 4 of the Securities Rules 2007, and the Financial Services Rules 2008. Trive MU is authorized and regulated by the Mauritius Financial Services Commission (FSC) and holds Global Business Licence number GB21026295 under Section 72(6) of the Financial Services Act. Trive SA and Trive MU are collectively known and referred to as “Trive Africa”.
Market and economic conditions are subject to sudden change which may have a material impact on the outcome of financial instruments and may not be suitable for all investors. Trive Africa and its employees assume no liability for any loss or damage (direct, indirect, consequential, or inconsequential) that may be suffered. Please consider the risks involved before you trade or invest. All trades on the Trive Africa platform are subject to the legal terms and conditions to which you agree to be bound. Brand Logos are owned by the respective companies and not by Trive Africa. The use of a company’s brand logo does not represent an endorsement of Trive Africa by the company, nor an endorsement of the company by Trive Africa, nor does it necessarily imply any contractual relationship. Images are for illustrative purposes only and past performance is not necessarily an indication of future performance. No services are offered to stateless persons, persons under the age of 18 years, persons and/or residents of sanctioned countries or any other jurisdiction where the distribution of leveraged instruments is prohibited, and citizens of any state or country where it may be against the law of that country to trade with a South African and/or Mauritius based company and/or where the services are not made available by Trive Africa to hold an account with us. In any case, above all, it is your responsibility to avoid contravening any legislation in the country from where you are at the time.
CFDs and other margin products are complex instruments and come with a high risk of losing money rapidly due to leverage. You should consider whether you understand how these products work and whether you can afford to take the high risk of losing your money. Professional clients can lose more than they deposit. See our full Risk Disclosure and Terms of Business for further details. Some or all of the services and products are not offered to citizens or residents of certain jurisdictions where international sanctions or local regulatory requirements restrict or prohibit them.