A notable shift has occurred in the US equity market over the past year. Investors have been captivated by the allure of high-growth companies propelled by the relentless march of artificial intelligence (AI). Consequently, companies focusing on dividends have struggled to maintain pace with the vibrant 2023 market surge.
This struggle is vividly illustrated by the lacklustre performance of the SPDR S&P Dividend ETF (NYSE Arca: SDY). Year-to-date, the ETF has witnessed a decline of 0.58%, trailing behind the robust returns of both the S&P 500 and Nasdaq 100, which have surged by 4.94% and 5.11%, respectively. This setback compounds the underperformance observed in 2023, where the ETF only managed a total return of 2.61%, failing to match the meteoric rise of the Nasdaq 100 (53.81%) and S&P 500 (24.23%).
The ETF’s primary objective is to mirror the total return of the S&P High Yield Dividend Aristocrats Index before fees. This index meticulously selects companies that have consistently increased dividends for at least two decades, weighting the stocks based on yield. Consequently, the underlying securities consist of large, well-established entities renowned for their ability to generate steady cash flows, facilitating generous dividend payouts.
However, the past year has seen these venerable value stocks fall out of favour as investors flock to the enticing returns promised by AI-centric stocks. Consequently, the ETF has grappled with the pressure to keep pace with the rapid ascent of the US equity market.
Yet, amidst this turbulence, there remains a glimmer of hope. With their long-standing stability, these stalwart value stocks offer a beacon of safety in uncertain times. Their potential resurgence in the forthcoming year could herald a return to prominence in the investment spotlight.
Technical
On the daily chart, a consolidation range has formed after a steady uptrend stemming from the end of last year. The convergence of the 25-SMA (green line) with the 50-SMA (blue line) signals the shift to neutrality in the market’s sentiment, while a decline in volumes further amplifies the market’s uncertainty around the next directional trend.
The consolidation has formed between 122.09 and 125.24, with the price using support from the 25-SMA to tease the upper resistance of this range. If a breakout occurs, the price could test resistance at 126.34, a challenging hurdle which previously halted a potential breakout. However, if this level gets cleared, a supply zone around 127.97 could become a likely destination. While a retest is possible from this supply zone, an additional bullish leg could lead the price toward 130.01 in the longer term.
Conversely, if the price fails to break above the resistance at 125.24, the price could retreat to continue its sideways movement. The support of the range could become vulnerable in this case, with a breakdown potentially triggering the formation of a new downtrend toward 120.01. The 100-SMA (orange line) offers support just below this level and could prevent a prolonged downturn toward the Fibonacci midpoint and 61.8% Fibonacci golden ratio at 118.07 and 116.13, respectively.

Fundamental
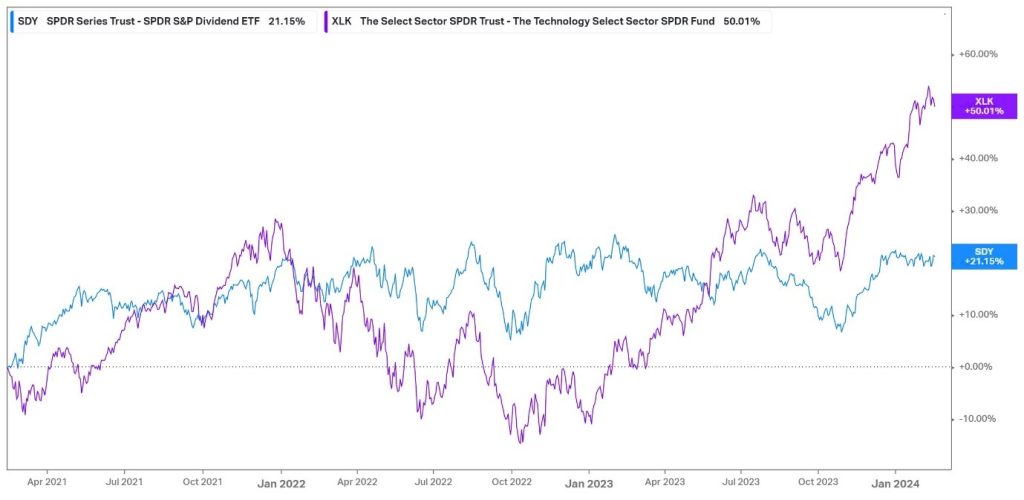
The chart below shows the inverse relationship between the technology sector, represented by the Technology Select SPDR fund, and the SPDR S&P Dividend ETF. Clear divergence occurred toward the end of last year, as technology stocks pulled away from the dividend ETF with a rapid rise, contributing to its 50.01% over the last three years, compared to the 21% advance of the dividend ETF. However, the characteristics of the price action are worth noting. While technology has outperformed, its price action comes with much larger swings, posing volatility risk compared to the stable price action of the dividend ETF. As a result, dividend stocks are preferred to technology during market downturns, as they present an element of safety to an investment portfolio.
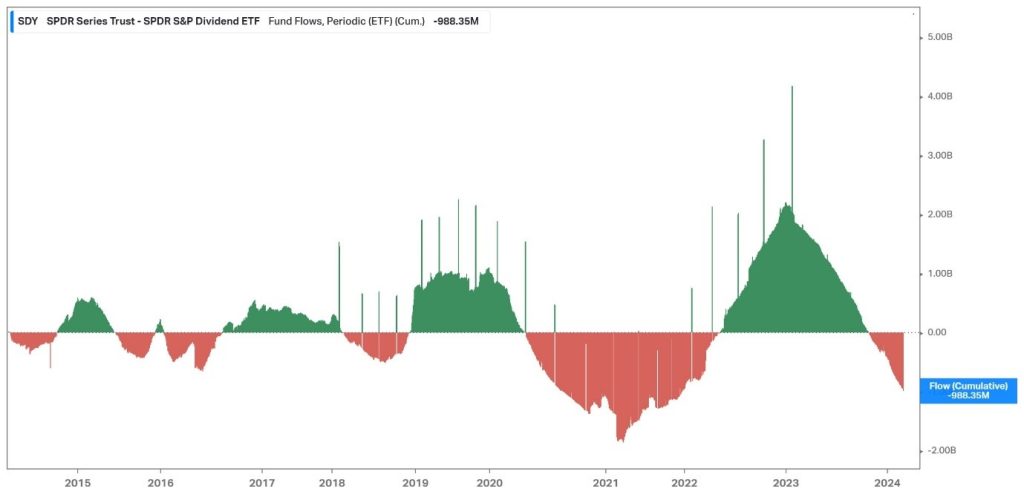
That said, due to the inverse relationship between technology and dividend-paying stocks over recent times, one can expect investors to rotate into and out of these sectors based on the level of economic activity. As seen below, the SPDR S&P Dividend ETF has been on the wrong end of this rotation recently, as it has experienced net outflows stemming from the end of last year, which has carried over into 2024. The fund flows are worth keeping an eye on to determine when investors are considering a rotation back to the safety that high-value dividend-paying stocks present. However, while currently dealing with net outflows, it is worth delving into why investors do not favour these stocks at the moment, apart from a growth thirst that only high-growth AI stocks can quench.
The chart below shows the rapid rise in US government bond yields since the second half of 2022, as the Federal Reserve engaged in an aggressive monetary policy tightening campaign. The US 2Y and 20Y yields cleared the 5% mark toward the end of last year, a substantial rise from the sub-1% levels witnessed toward the end of the COVID-19 pandemic. This rise in yields has impacted investor sentiment toward dividend stocks, as it makes the additional yield that dividends provide less attractive compared to the surging government bond yields, which come at a much lower level of risk. As we advance, if the Federal Reserve engages in rate cuts, we could witness a decline in US treasury yields, potentially improving sentiment regarding dividend-paying stocks.

As previously mentioned, dividend-paying stocks have historically outperformed during periods of market downturn. As things stand in the US, the Conference Board sees weak conditions in manufacturing, low consumer confidence and high-interest rates offsetting the positive contributions made to its leading economic indicator (LEI). The LEI’s six-month and twelve-month growth rates remain negative, suggesting the continued risk of a recession ahead. Overall, the Conference Board expects GDP growth to turn negative in the second and third quarters of 2024. If their prediction plays out and the US edges toward a recession, there could be room for dividend-paying stocks to make a return, creating a potential tailwind for SDY in the coming months.
Summary
The SPDR S&P Dividend ETF made a slow start to the year, adding to the underperformance from 2023. However, with uncertainty currently looming large surrounding the timeline of Federal Reserve rate cuts, and whether a soft landing could be achieved, there remains room for dividend-paying stocks to come back into investor portfolios if the US economy falls into a downturn.
Sources: Koyfin, Tradingview, Reuters, The Conference Board
Piece written by Tiaan van Aswegen, Trive Financial Market Analyst
Disclaimer: Trive South Africa (Pty) Ltd (hereinafter referred to as “Trive SA”), with registration number 2005/011130/07, is an authorised Financial Services Provider in terms of the Financial Advisory and Intermediary Services Act, 37 of 2002. Trive SA is authorised and regulated by the South African Financial Sector Conduct Authority (FSCA) and holds FSP number 27231. Trive Financial Services Ltd (hereinafter referred to as “Trive MU”) holds an Investment Dealer (Full-Service Dealer, excluding Underwriting) Licence with licence number GB21026295 pursuant to section 29 of the Securities Act 2005, Rule 4 of the Securities Rules 2007, and the Financial Services Rules 2008. Trive MU is authorized and regulated by the Mauritius Financial Services Commission (FSC) and holds Global Business Licence number GB21026295 under Section 72(6) of the Financial Services Act. Trive SA and Trive MU are collectively known and referred to as “Trive Africa”.
Market and economic conditions are subject to sudden change which may have a material impact on the outcome of financial instruments and may not be suitable for all investors. Trive Africa and its employees assume no liability for any loss or damage (direct, indirect, consequential, or inconsequential) that may be suffered. Please consider the risks involved before you trade or invest. All trades on the Trive Africa platform are subject to the legal terms and conditions to which you agree to be bound. Brand Logos are owned by the respective companies and not by Trive Africa. The use of a company’s brand logo does not represent an endorsement of Trive Africa by the company, nor an endorsement of the company by Trive Africa, nor does it necessarily imply any contractual relationship. Images are for illustrative purposes only and past performance is not necessarily an indication of future performance. No services are offered to stateless persons, persons under the age of 18 years, persons and/or residents of sanctioned countries or any other jurisdiction where the distribution of leveraged instruments is prohibited, and citizens of any state or country where it may be against the law of that country to trade with a South African and/or Mauritius based company and/or where the services are not made available by Trive Africa to hold an account with us. In any case, above all, it is your responsibility to avoid contravening any legislation in the country from where you are at the time.
CFDs and other margin products are complex instruments and come with a high risk of losing money rapidly due to leverage. You should consider whether you understand how these products work and whether you can afford to take the high risk of losing your money. Professional clients can lose more than they deposit. See our full Risk Disclosure and Terms of Business for further details. Some or all of the services and products are not offered to citizens or residents of certain jurisdictions where international sanctions or local regulatory requirements restrict or prohibit them.