The S&P 500 Index (CME: ES) is nearing a record-high, closing just shy of its all-time peak as the year concludes with strong bullish momentum. Expectations of an interest rate pivot by the Fed in 2024 have become firmly entrenched, buoying sentiment for growth-oriented stocks. The recent dovish rhetoric from policymakers and signs of softening economic data have cemented this narrative.
The “Magnificent Seven” – Apple, Amazon, Microsoft, Alphabet, Meta, Tesla, and Nvidia – have been on a tear, contributing significantly to the S&P 500’s gains. Their earnings strength and potential to thrive in the AI-driven future continue to entice investors.
Year-end tax considerations and thin holiday trading volumes can amplify upward trends, potentially pushing the index towards record territory in the final trading session for the year.
Technical
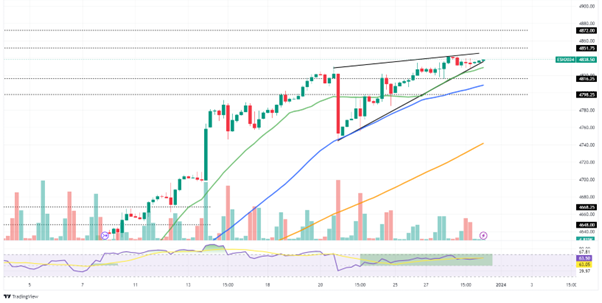
The 4-hour chart shows that the S&P 500 has been trading within a rising wedge pattern for weeks, indicating a potential for a breakout or breakdown. The recent dip found support at the wedge’s lower trendline, offering a temporary reprieve for the bulls.
The 20-SMA (green line), 50-SMA (blue line), and 100-SMA (orange line) all slope upwards, suggesting an ongoing bullish trend. The 20-EMA remains comfortably above the other SMAs, further reinforcing the bullish bias.
Short-term opportunities may arise towards the 4,851.75 resistance level. Further bullish strides could test the 4,872.00 resistance. Conversely, exhaustion of the upward move and possibly a break below the wedge could offer short-term trading opportunities towards the 4,816.25 support level lower. A break below the initial support would bring the 4,798.25 support level into play in the short term.
Summary
The S&P 500 is on the cusp of a historic milestone, but the path ahead is not without its challenges. While the fundamentals appear favourable for now, a potential shift in market sentiment, profit-taking after the year-end rally, or a technical breakdown from the rising wedge could derail the momentum.
Sources: TradingView, Trading Economics, Reuters, Dow Jones Newswire.
Piece written by Mfanafuthi Mhlongo, Trive Financial Market Analyst
Disclaimer: Trive South Africa (Pty) Ltd, Registration number 2005/011130/07, and an Authorised Financial Services Provider in terms of the Financial Advisory and Intermediary Services Act 2002 (FSP No. 27231). Any analysis/data/opinion contained herein are for informational purposes only and should not be considered advice or a recommendation to invest in any security. The content herein was created using proprietary strategies based on parameters that may include price, time, economic events, liquidity, risk, and macro and cyclical analysis. Securities involve a degree of risk and are volatile instruments. Market and economic conditions are subject to sudden change, which may have a material impact on the outcome of financial instruments and may not be suitable for all investors. When trading or investing in securities or alternative products, the value of the product can increase or decrease meaning your investment can increase or decrease in value. Past performance is not an indication of future performance. Trive South Africa (Pty) Ltd, and its employees assume no liability for any loss or damage (direct, indirect, consequential, or inconsequential) that may be suffered from using or relying on the information contained herein. Please consider the risks involved before you trade or invest.