
The Nasdaq 100 Index (CME: NQ) remains on an impressive streak, eyeing its ninth straight week of gains and an outstanding yearly return of 53.83%, leaving the index on course for its best year since the dot-com era, fuelled by a surge in tech stocks amid artificial intelligence (AI) exuberance and a dovish Fed stance.
The Fed’s anticipated rate cuts in early 2024 continue to buoy the market sentiment, particularly in technology stocks driven by the artificial intelligence surge. While mixed economic data poses dovish elements for the Fed, energy stocks suffered from a decline in crude prices.
However, with a potential soft landing on the horizon and much of the earnings growth already priced in, questions linger about the sustainability of this tech-driven rally.
Technical
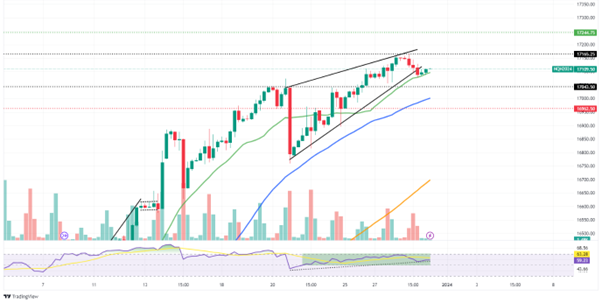
The 4-hour chart shows that the Nasdaq 100, trading around 17,109.50, found support at the 20-SMA after breaking below a rising wedge pattern. Currently above the 20-SMA (green line), 50-SMA (blue line), and 100-SMA (orange line), the index shows a slightly higher RSI of 59.23, indicating bullish momentum.
Short-term trading opportunities could exist towards the 17,165.25 resistance level should the upward trajectory be sustained, with a push above the 17,165.25 resistance level likely to open the door to 17,244.75, with further strength targeting the recent all-time highs. However, exhaustion of the current upward move could lead to a pullback towards 17,043.50, with a break below that level potentially targeting 16,962.50.
Summary:
The Nasdaq 100 Index remains in a bullish posture as the year draws to a close. However, it’s worth monitoring potential profit-taking and a possible shift in market sentiment as the new year approaches. While the AI frenzy and expectations of Fed easing are providing support, opportunities lower could exist should key moving averages give way.
Sources: TradingView, Trading Economics, Reuters, Dow Jones Newswire.
Piece written by Mfanafuthi Mhlongo, Trive Financial Market Analyst
Disclaimer: Trive South Africa (Pty) Ltd, Registration number 2005/011130/07, and an Authorised Financial Services Provider in terms of the Financial Advisory and Intermediary Services Act 2002 (FSP No. 27231). Any analysis/data/opinion contained herein are for informational purposes only and should not be considered advice or a recommendation to invest in any security. The content herein was created using proprietary strategies based on parameters that may include price, time, economic events, liquidity, risk, and macro and cyclical analysis. Securities involve a degree of risk and are volatile instruments. Market and economic conditions are subject to sudden change, which may have a material impact on the outcome of financial instruments and may not be suitable for all investors. When trading or investing in securities or alternative products, the value of the product can increase or decrease meaning your investment can increase or decrease in value. Past performance is not an indication of future performance. Trive South Africa (Pty) Ltd, and its employees assume no liability for any loss or damage (direct, indirect, consequential, or inconsequential) that may be suffered from using or relying on the information contained herein. Please consider the risks involved before you trade or invest.