
Supply cuts by Saudi Arabia and Russia kept the WTI Crude Oil Futures (NYMEX: CL) afloat amid macroeconomic concerns in China. However, demand for oil remains robust, with Chinese Imports rebounding from -12.4% to -7.3%, ahead of the forecasted -9%. Additionally, the US Energy Information Administration reported a substantial drawdown of 6.3 million barrels in the past week, bringing oil inventories to their lowest levels since December 2022.
Oil prices reached their highest in 10 months, a surge precipitated by Riyadh and Moscow’s joint commitment to prolong their voluntary supply cuts until year end, which amount to a combined reduction of 1.3 million barrels per day (bpd). Meanwhile, the likelihood of US interest rates remaining elevated has made acquiring crude oil in other currencies a more costly endeavour, thereby gravely impacting demand. Will a hawkish tone continue to flood the oil market, or will the WTI crude oil futures bounce to new heights?
Technical
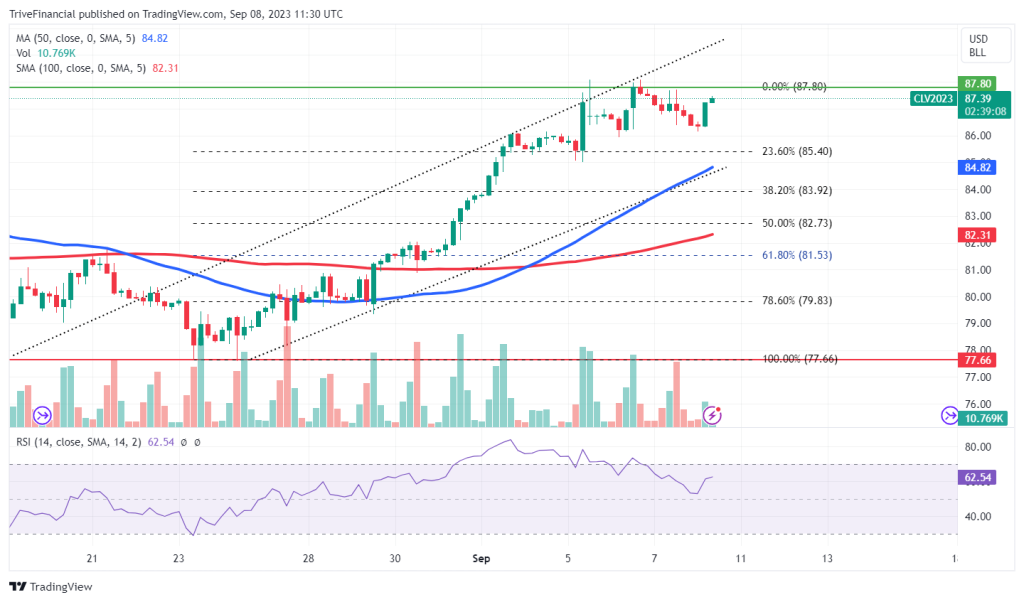
An ascending channel pattern has formed on the 4H Chart, with the WTI crude oil futures reaching a 10-month high. As the 50-day moving average line diverges further away from the 100-day moving average line, the price action may attempt to retest the $87.80/BLL major resistance. In this case, the Futures could propel to new heights, with a move in line with the channel’s upper boundary, possibly marking the continuation of an uptrend.
However, a drop in buying volume may encourage a pullback in an attempt to restore equilibrium between supply and demand. In this case, the $85.40/BLL support at the 23.60% Fibonacci Retracement could be a point of interest in driving downside momentum towards the channel’s lower boundary.
Summary
The WTI Crude Oil Futures edged higher on the backdrop of a rise in China’s imports, which exhibited an underlying increase in demand against further supply cuts from Saudi Arabia and Russia. If the Futures continue to tick up, the $87.80/BLL major resistance may affirm the continuation of the ascending channel pattern. However, dwindling buying volume may encourage a pullback and edge the price action towards the $85.40/BLL support at the 23.60% Fibonacci level.
Sources: TradingView, EIA, Reuters
Disclaimer: Trive South Africa (Pty) Ltd, Registration number 2005/011130/07, and an Authorised Financial Services Provider in terms of the Financial Advisory and Intermediary Services Act 2002 (FSP No. 27231). Any analysis/data/opinion contained herein are for informational purposes only and should not be considered advice or a recommendation to invest in any security. The content herein was created using proprietary strategies based on parameters that may include price, time, economic events, liquidity, risk, and macro and cyclical analysis. Securities involve a degree of risk and are volatile instruments. Market and economic conditions are subject to sudden change, which may have a material impact on the outcome of financial instruments and may not be suitable for all investors. When trading or investing in securities or alternative products, the value of the product can increase or decrease meaning your investment can increase or decrease in value. Past performance is not an indication of future performance. Trive South Africa (Pty) Ltd, and its employees assume no liability for any loss or damage (direct, indirect, consequential, or inconsequential) that may be suffered from using or relying on the information contained herein. Please consider the risks involved before you trade or invest.