
WTI crude’s (NYMEX: CL) recent rally seems to be losing steam, with two consecutive days of declines casting a shadow over its year-end gains. Oil prices sustained a 2.13% decline in the previous session amid eased concerns regarding shipping disruptions in the Red Sea.
The increase of 1.84 million barrels in US crude inventories, coupled with expanded inventory levels at Cushing, signalled an excess in supply versus demand as the year-end approached. Despite an initial rise triggered by Houthi attacks causing disruptions, major shipping firms’ return to the Red Sea route tempered price gains. Additionally, the lack of coordinated action from the US-led coalition amidst Middle East tensions adds uncertainty.
The potential for interest rate cuts in Europe and the US in 2024 is seen positively for oil demand, likely prompting a market attempt towards an upside, especially in the new year.
Technical Analysis:
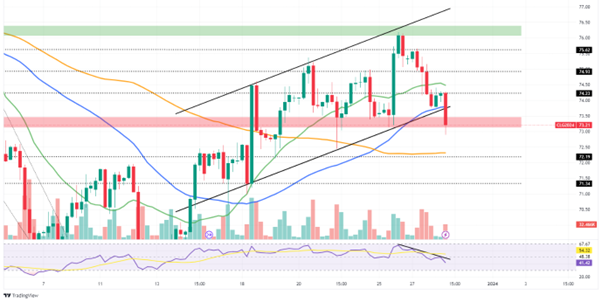
The 4-hour chart shows that WTI crude oil currently trades at $73.21/BLL within a demand zone post a break below the ascending channel pattern. The price trades comfortably below the 20-SMA (green line) and the recent breach beneath the 50-SMA (blue line) and a falling RSI at 41.42 signal bearish momentum. However, the demand zone and 100-SMA (orange line) could provide significant support in the short-term.
Short-term trading opportunities may arise towards the support level at $72.19/BLL if bears sustain a push below the demand zone. A break below this level could confirm the bearish momentum, likely targeting the $71.34/BLL support level as the next level of significance lower.
However, a rejection of the demand zone could present an opportunity for a counter-trend rally towards the initial resistance at $74.23/BLL. A break above this level leave the $74.93/BLL and $75.62/BLL resistance levels within the bulls reach in the short-term.
Summary:
WTI crude oil is facing a confluence of bearish factors, with eased Red Sea tensions, rising inventories, and technical indicators pointing towards a potential downtrend. However, the possibility of future demand increases and the presence of a demand zone offer a glimmer of hope for bulls.
While short-term trading opportunities exist in both directions, the overall bearish headwinds could offer potential for further downside towards $72.19/BLL and possibly, lower.
Sources: TradingView, Reuters, Trading Economics, Trading Economics.
Piece written by Mfanafuthi Mhlongo, Trive Financial Market Analyst
Disclaimer: Trive South Africa (Pty) Ltd, Registration number 2005/011130/07, and an Authorised Financial Services Provider in terms of the Financial Advisory and Intermediary Services Act 2002 (FSP No. 27231). Any analysis/data/opinion contained herein are for informational purposes only and should not be considered advice or a recommendation to invest in any security. The content herein was created using proprietary strategies based on parameters that may include price, time, economic events, liquidity, risk, and macro and cyclical analysis. Securities involve a degree of risk and are volatile instruments. Market and economic conditions are subject to sudden change, which may have a material impact on the outcome of financial instruments and may not be suitable for all investors. When trading or investing in securities or alternative products, the value of the product can increase or decrease meaning your investment can increase or decrease in value. Past performance is not an indication of future performance. Trive South Africa (Pty) Ltd, and its employees assume no liability for any loss or damage (direct, indirect, consequential, or inconsequential) that may be suffered from using or relying on the information contained herein. Please consider the risks involved before you trade or invest.