Following the largest one-day loss since September on Wednesday, the S&P 500 futures (CME: ES) have made a swift recovery, reclaiming a substantial portion of their losses in the wake of the latest GDP growth announcement. Thursday brought news of the US’s 4.9% quarter-on-quarter GDP growth, slightly below the anticipated 5.2%.
This development has fuelled speculation in the market, reinforcing expectations of potential rate cuts by the Federal Reserve by March of the coming year. The upcoming Core PCE Price Index, with an anticipated decrease from the previous year’s 3.5% to 3.3%, holds the potential to be a game-changer. If this materializes, it could signify significant strides in the battle against inflation, providing an additional catalyst for the equity market’s rally towards the year-end.
Technical
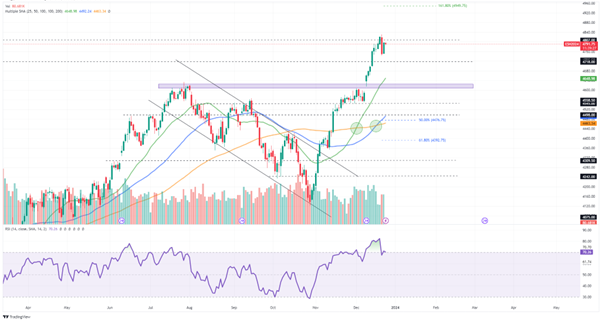
On the daily chart, the bullish momentum is evident, with the futures racking up ten days in the green out of the last eleven. Resistance at 4,807.00 triggered a temporary pullback, but the price action remains above the 25-SMA (green line), signalling a bullish bias.
If the resistance at 4,807.00 continues to hold, the support at 4,718.00 could be the first potential hurdle to the pullback. An additional leg below this support could open the futures up to a retest at the prior supply zone, which now acts as support at 4,625.50. The 50-SMA (blue line) and 100-SMA (orange line) lie close to the Fibonacci midpoint from the current peak at 4,476.75 and could become levels of interest if a pullback occurs.
However, if the resistance at 4,807.00 fails to contain the bullish momentum, the current uptrend could continue through the end of the year. From the late October bottom, the 161.8% Fibonacci extension at 4,949.75 could be a crucial level to watch if a continuation occurs.
Summary
The S&P 500 swiftly recovered from a Wednesday selloff and now anticipates the release of the PCE data later today as a potential driver of future price action. Resistance at 4,807.00 could be a critical level to watch in the upcoming session.
Sources: Koyfin, Tradingview
Piece written by Tiaan van Aswegen, Trive Financial Market Analyst
Disclaimer: Trive South Africa (Pty) Ltd, Registration number 2005/011130/07, and an Authorised Financial Services Provider in terms of the Financial Advisory and Intermediary Services Act 2002 (FSP No. 27231). Any analysis/data/opinion contained herein are for informational purposes only and should not be considered advice or a recommendation to invest in any security. The content herein was created using proprietary strategies based on parameters that may include price, time, economic events, liquidity, risk, and macro and cyclical analysis. Securities involve a degree of risk and are volatile instruments. Market and economic conditions are subject to sudden change, which may have a material impact on the outcome of financial instruments and may not be suitable for all investors. When trading or investing in securities or alternative products, the value of the product can increase or decrease meaning your investment can increase or decrease in value. Past performance is not an indication of future performance. Trive South Africa (Pty) Ltd, and its employees assume no liability for any loss or damage (direct, indirect, consequential, or inconsequential) that may be suffered from using or relying on the information contained herein. Please consider the risks involved before you trade or invest.